Emission Data Monitoring Technology
How to measure fuel consumption and CO2 emissions?
Measuring fuel consumption in daily life, is usually done by collecting gasoline bills and divide by mileage. Thus, the unit is simply liter divided by 100 km, often indicated in [lph]. Most people know, that this method gives a good approximation for longer trips overland or after a number of urban trips, e.g. from home to work.
Another well-known method is technically much more advanced and uses the electronic connection to the CAN-Bus. Typically, an array of liter per 100 km or/and liters per second is collected via such CAN-Bus connections and is recorded in an external computer or transferred to a database via an On-Board-Unit (OBU’s) with integrated telecommunication module. When combined with a GPS device, such OBU’s can match the trip to a digital map and help fleet operators to analyze the trip and its fuel consumption on street level.
Even though these methods are widely used since long time, there are certain limits when it comes to daily fleet operation for dispatchers and drivers. First of all, there is often not enough money to equip an entire fleet with expensive OBU’s, exclusively for sporadic fuel measurements and eco-drive training strategies. Secondly, many logistics’ companies have leasing contracts with in-vehicle equipment already – basically for this they have no interest to re-equip their vehicle fleet just for several months of operation with telematics devices. Another problem lies in understanding specific reasons for low or high fuel consumption:
- What happened during the trip? Where actually was the focus of the tour - “urban, extra-urban or highway”? Did the trip cover mountain regions or not?
- Was there some specific good or bad driving behavior? Did the driver have a gentle or aggressive mind while using the gas pedal?
- Traffic flow might influence the trip, number of tolling stations can cause serious delay times but also make drivers accelerate smoothly (coasting) or aggressive wasting fuel.
- Technical issues play another strong influence. Tire pressure as well as engine tuning will help to save fuel, including engine characteristics related to load.
- Extreme problems for logistics operators are related to fuel theft and fraud as well as to technical default, e.g. the CAN-Bus connection or fuel losses by defective tube systems.
For all of these reasons, the simple liter per 100 km or liter per second value gives not enough answers to fuel consumption and additional information is helpful for long-term fruitful Eco-Drive training strategies and smooth engine operation. In especially in the logistics truck market, fuel consumption is critical with regards to the overall costs of transport goods and for the sake of achieving profitable business.
What are the advantages of a sophisticated technology developed for calculating fuel consumption compared to simply analyzing the fuel bill?
For logistics and fleet operators analyzing the fuel bill is a method of monitoring the fuel consumption on a highly aggregated scale. This analysis is done by extracting data out of the companies’ enterprise resource planning system and it is done ex-post. Thus, the logistic operator knows how much fuel has been consumed in a certain period (normally on a monthly or quarterly basis). The operator can also compare the fuel bills of different drivers and so he is able to identify what is the minimum of fuel consumption within the respective time period and kilometers driven. However, by analyzing the fuel bills the operator is not in the position to draw the differentiated conclusion how and where fuels could have been saved during the single trip. The aggregated data blurs this important information. The technology we have developed enables logistics and fleet operators to localize energy waste and CO2 emission by using a business intelligence application for energy efficiency based on a kinetic physical model. In principal, we follow the approach from data to information to knowledge.
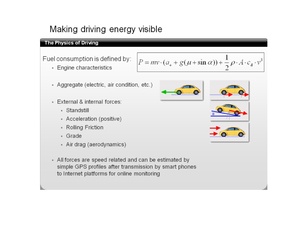
Energy analysis on GPS profile monitoring helps to complement absolute fuel values detected by CAN bus or registered by fuel bills in ERP systems. At this point it should be stated that as long as GPS based fuel analysis is related to reference cycles and standard values (rolling friction, etc.), it does not fully replace fuel measurements. But it is very helpful to understand fuel losses or savings based on analysis of energy contributors.
Generally spoken, there are four domains of factors which contribute to the energy consumption of vehicles of all kind:
- External factors, which cannot be influenced, neither by the operator nor by the driver. These factors are e.g. traffic and weather conditions, gradient.
- Vehicle specific factors, which cannot be influenced, neither by the operator nor by the driver. These factors are e.g. efficiency of the engine (drive propulsion system), permanent working auxiliary aggregates, rolling friction, aerodynamics (effect can be lowered by driving behavior)
- Vehicle specific factors, which can be influenced by the operator or by the driver. These factors are e.g. tire pressure, engine oil, usage of nose cones (improves aerodynamics) and usage of electric aggregates, etc.
- Behavioral factors of the driver, e.g. acceleration (positive), braking, coasting, standstill (standstill is also caused by traffic conditions), etc.
The technology we provide is a combination of mobile communication, GPS profile monitoring and cloud based computing. We focus here on the domain of driver behavior. The operator and the driver will be provided with relevant fuel consumption data in real time.
The data collected in the back-end data base can be used for different purposes by different stakeholders:
- The driver can adjust his driving behavior.
- The fleet operator can do pre- and post-trip analysis of single trips and groups of trips according to different selection criteria.
- A ranking of eco drivers is possible based on the implemented eco-index.
- Target setting can be done with the data collected, i.e. consumption goals can be delegated to drivers or, in turn, incentive schemes for eco driving can be set up.
- City or provincial municipalities and their authorities can use the data for the modeling of environmental zones or other planning issues.
How does the technology work? What are the advantages?
The Platform
As mentioned, the technology is a combination of mobile communication with smart phones, GPS profiling and cloud based computing. The core of the system architecture is the Advanced Telematics Platform (ATP) developed by Deutsche Telekom. The ATP is an integrated and open platform capable of providing mobile phone and satellite based I.T.S (Intelligent Transport Systems) services, including traffic information collection and dissemination, vehicle trace and tracking, road charging, emission modelling, e-parking and other value-added services.
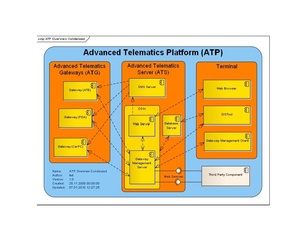
The ATP platform has an integrated communication module which allows bi-directional communication between the equipped vehicle and the data center where the ATP is operated.
Several components of the ATP have to be configured and a pre-configuration of several physical parameter of the vehicle have to be downloaded from the back end to the in-vehicle devices. Once the configuration is finalized, the data base can be accessed from anywhere in the world via secure Internet connections.
GPS-based Driving Profiles
The trips are mapped as kml-tracks and can be visualized on Google maps or other suitable solutions. Tracks of trips are indicated in red, yellow and green according to the energy consumption profile of the driver.

The mobile devices, On Board Devices (OBD)
The mobile devices provide a simple graphic user interface (GUI) to the driver with only a few configuration items so the usability for the driver is given.
The driving behavior of the driver is indicated with colors and values derived from the processing of the different energy contributors and signaling classes. “Gentle” driving behavior equals green, “normal” driving behavior equals yellow and “aggressive” driving behavior equals red. The threshold is simply set by indicators derived out of three reference cycles: the ECE-cycle for urban traffic, the EUDC cycle for extra urban traffic and the 90 km/h for trucks.
The Back-end Application for Trip Analysis
The data collected is stored in the back end database. The operator can access the user frontend via web and secure access. Data analysis is available with the help of different selection criteria according to the needs and requirements of the operator.
Trips can be analyzed by the following criteria (selection of most important queries, standard boolean AND and OR queries are possible):
- Trip by length/distance
- Trip by duration/time
- Trip by date and daytime
- Time lost per trip (i. e. driving under 10 kph)
- Fuel saved or lost with equivalent RMB-Value
- Average speed (plus simple standard deviation)
- Average fuel (plus simple standard deviation)
- Eco-Index 1 = lph / ton
- Eco-Index 4 = kWh / km * ton
- Type of load (mass or volume)
- Weight class
Additionally, all data can be exported into Excel files (csv-format), which allows deeper manual analysis, for example single trips can be analyzed on the basis of the topographic profile of the route. Thus, it can be analyzed and assessed how the driver behaves in hilly regions when he is going uphill.


