|
|
| (29 intermediate revisions by 3 users not shown) |
| Line 1: |
Line 1: |
| − | == What is Environment Assessment? ==
| |
| | | | |
| − | The first step towards a [[Watershed Action Planning related to MHP projects in Ethiopia|watershed action plan]] is an Environment Assessment, which includes the selection, compilation and mapping of data on the watershed, with the aim to show its current environmental condition. The implementation of Environment Assessment helps to identify any existing environmental impacts and thus what [[Mitigation and Intervention Techniques related to MHP projects in Ethiopia|mitigation techniques]] need to be implemented within the watershed action plan.
| + | = Overview = |
| | | | |
| − | == Biophysical and socio-economic survey ==
| + | ► [[Watershed_Action_Planning_related_to_Micro-hydro_Power_(MHP)_Projects_in_Ethiopia|Watershed Action Planning related to Micro-hydro Power (MHP) Projects in Ethiopia]] |
| | | | |
| − | In order to assess as much environmental information on the target area as possible, it is important to consider both, biophysical as well as socio-economic features of the watershed. The most effective way to do so is a combination of landscape observation, interviews and mapping. A checklist and questionnaire help to note down the findings of the landscape observation and the interviews. Maps help to illustrate the environmental condition of the watershed and thus to locate points of interest such as [[Causes and Features of Watershed Degradation related to MHP Projects in Ethiopia|degradation features]], wetlands and spring areas.
| + | <br/> |
| | | | |
| − | === ''How to use the questionnaire and the checklist'' === | + | = Environment Assessment<br/> = |
| | | | |
| − | The checklist (see fig. 1) and the questionnaire (see fig.2) include a variety of questions and features, all of them having different answer modalities (ranging from qualitative to quantitative). In order to fill in the questionnaire and the checklist it is thus of great importance to not only observe the landscape and to take measurements but also to interview people (inhabitants and/or officials) when required. To make the results of the survey more detailed, the watershed should roughly be divided into (at least) two parts: the upstream and the downstream region. Depending on the size of the watershed, further subdivision might be useful. For each sub-region the questionnaire and the checklist should be filled in.<br> | + | The first step towards a [[Watershed_Action_Planning_related_to_Micro-hydro_Power_(MHP)_Projects_in_Ethiopia|watershed action plan]] is an Environment Assessment, which includes the selection, compilation and mapping of data on the watershed, with the aim to show its current environmental condition. The implementation of Environment Assessment helps to identify any existing environmental impacts and thus what [[Mitigation_and_Intervention_Techniques_Related_to_Micro-hydro_Power_(MHP)_Projects|mitigation techniques]] need to be implemented within the watershed action plan. |
| | | | |
| − | {| class="FCK__ShowTableBorders" cellspacing="1" cellpadding="1" width="200" border="0"
| + | <br/> |
| − | |-
| |
| − | | [[Image:Checklist Environment Assessment related to MHP projects in Ethiopia.pdf|242x342px|Checklist Environment Assessment related to MHP projects in Ethiopia.pdf]]
| |
| − | |
| |
| − | <br>'''Fig.1:''' | |
| − | | |
| − | '''Checklist '''
| |
| − | | |
| − | | [[Image:Questionnaire Environment Assessment related to MHP projects in Ethiopia.pdf|225x318px|Questionnaire Environment Assessment related to MHP projects in Ethiopia.pdf]]
| |
| − | |
| |
| − | <br>'''Fig. 2:'''
| |
| − | | |
| − | '''Questionnaire '''
| |
| | | | |
| − | |}
| + | = Biophysical and Socio-economic Survey = |
| | | | |
| − | <br>
| + | In order to assess as much environmental information on the target area as possible, it is important to consider both, biophysical as well as socio-economic features of the watershed. The most effective way to do so is a combination of landscape observation, interviews and mapping. A checklist and questionnaire help to note down the findings of the landscape observation and the interviews. Maps help to illustrate the environmental condition of the watershed and thus to locate points of interest such as [[Causes_and_Features_of_Watershed_Degradation_related_to_MHP_Projects|degradation features]], wetlands and spring areas. |
| | | | |
| − | === ''How to draw a map'' ===
| + | <br/> |
| | | | |
| − | To delineate the watershed boundaries, use a topographic map (scale 1: 50 000) of the area and enlarge it once (1: 25 000) or twice (1: 12 500). The outlet should be the location of the MHP station (see fig. 3). To calculate the area of the watershed, use a grid square (print it on a foil and lay it over the map, see fig. 4). In order to map parts of the watershed in greater detail, the map can be further enlarged<ref>DESTA, L. ET AL. (2005): Part 2: Community Based Participatory Watershed Development: Annex. Addis Ababa: Ministry of Agriculture and Rural Development.</ref>.
| + | == How to Use the Questionnaire and the Checklist == |
| | | | |
| − | Once the base map is drawn in accordance with the work scale (depending on how detailed the map must be), all information of interest (land use, land cover, springs, wetlands, rivers, degraded areas, infrastructure, slopes, soil texture and other) can be filled in (see fig.5). If there is no GPS available, landmarks such as rivers that are found on the topographic map can be used for orientation. Either all information can be noted on one map, or several thematic maps can be created, showing for example only springs and wetlands or degraded areas.
| + | The checklist and the questionnaire include a variety of questions and features, all of them having different answer modalities (ranging from qualitative to quantitative). In order to fill in the questionnaire and the checklist it is thus of great importance to not only observe the landscape and to take measurements but also to interview people (inhabitants and/or officials) when required. To make the results of the survey more detailed, the watershed should roughly be divided into (at least) two parts: the upstream and the downstream region. Depending on the size of the watershed, further subdivision might be useful. For each sub-region the questionnaire and the checklist should be filled in.<br/> |
| | | | |
| − |
| + | {| cellspacing="1" cellpadding="1" border="1" style="width: 100%" class="FCK__ShowTableBorders" |
| − | | |
| − | {| class="FCK__ShowTableBorders" cellspacing="1" cellpadding="1" width="200" border="0" | |
| | |- | | |- |
| − | | [[Image:Watershed Deliniation Topographic Map.png|300x316px|Watershed Deliniation Topographic Map.png]] | + | | style="width: 383px" | <p style="text-align: center">'''Checklist''':<br/></p> |
| − | |
| + | | style="width: 373px" | <p style="text-align: center">'''Questionnaire:'''</p> |
| − | '''Fig. 3 :'''
| |
| − | | |
| − | '''Watershed deliniation on '''
| |
| − | | |
| − | '''topographic map ''' ''' ''' | |
| − | | |
| − | |
| |
| − | [[Image:Grid Square for Area Calculation.png|131x194px|Grid Square for Area Calculation.png]]
| |
| − | | |
| − |
| |
| − | | |
| − | |
| |
| − | '''Fig. 4:'''
| |
| − | | |
| − | '''Grid square for area'''
| |
| − | | |
| − | '''calculation '''
| |
| − | | |
| − | <br> | |
| − | | |
| − | <br> | |
| − | | |
| − | <br> | |
| − | | |
| − | <br>
| |
| − | | |
| − | ''' ''' | |
| − | | |
| − | |}
| |
| − | | |
| − |
| |
| − | | |
| − | {| class="FCK__ShowTableBorders" cellspacing="1" cellpadding="1" width="200" border="0"
| |
| | |- | | |- |
| − | | [[Image:Example work map.png|303x171px|Example work map.png]] | + | | style="width: 383px; text-align: center" | [[File:Checklist Environment Assessment related to MHP projects in Ethiopia.pdf|thumb|center|180px|Checklist Environment Assessment related to MHP projects in Ethiopia.pdf]] |
| − | | | + | | style="width: 373px; text-align: center" | [[File:Questionnaire Environment Assessment related to MHP projects in Ethiopia.pdf|thumb|center|180px|Questionnaire Environment Assessment related to MHP projects in Ethiopia.pdf]] |
| − | ''' Fig. 5:'''
| |
| − | | |
| − | ''' Example work map '''
| |
| − | | |
| | |} | | |} |
| | | | |
| − | <br> | + | <br/> |
| | | | |
| − | == Identification of major problems and problem areas == | + | == How to Draw a Map == |
| | | | |
| − | Once the biophysical and socio-economic survey is done, the [[Watershed Planning Team related to MHP Projects in Ethiopia|watershed planning team]] should analyze the collected data carefully in order to assess major problems and problem areas within the watershed. Identified problems should be ranked according to priority (regarding both, quantity and degree of degradation).
| + | To delineate the watershed boundaries, use a topographic map (scale 1: 50 000) of the area and enlarge it once (1: 25 000) or twice (1: 12 500). The outlet should be the location of the Micro-hydro Power (MHP) station (see fig. 3). |
| | | | |
| − | Results of the environment assessment should be:
| + | To calculate the area of the watershed, use a grid square (print it on a foil and lay it over the map, see fig. 4). In order to map parts of the watershed in greater detail, the map can be further enlarged<ref>DESTA, L. ET AL. (2005): Part 2: Community Based Participatory Watershed Development: Annex. Addis Ababa: Ministry of Agriculture and Rural Development.</ref>. |
| | | | |
| − | a) a '''list of the identified problems of the watershed ranked by priority '''and
| + | Once the base map is drawn in accordance with the work scale (depending on how detailed the map must be), all information of interest (land use, land cover, springs, wetlands, rivers, degraded areas, infrastructure, slopes, soil texture and other) can be filled in (see fig.5). If there is no GPS available, landmarks such as rivers that are found on the topographic map can be used for orientation. Either all information can be noted on one map, or several thematic maps can be created, showing for example only springs and wetlands or degraded areas. |
| | | | |
| − | b) a '''map and/or several thematic maps''', showing the watershed’s environmental condition and problem areas. <br>
| + | <br/> |
| | | | |
| − | <br>
| + | {| cellspacing="1" cellpadding="1" border="0" style="width: 100%" class="FCK__ShowTableBorders" |
| − | | |
| − | == Example: Environment Assessment for the [[MHP Gobecho I|Gobecho catchment (Ethiopia)]] ==
| |
| − | | |
| − | <br>
| |
| − | | |
| − | {| class="FCK__ShowTableBorders" cellspacing="1" cellpadding="1" width="100%" border="0" | |
| | |- | | |- |
| | + | | [[File:Watershed Deliniation Topographic Map.png|thumb|center|221px|Watershed Deliniation Topographic Map.png]] |
| | + | | <br/> |
| | | | | | |
| − | [[Image:Gobecho catchment.jpg|364x595px|Gobecho catchment.jpg]]<br> | + | [[File:Grid Square for Area Calculation.png|thumb|center|146px|Grid Square for Area Calculation.png]] |
| − | | |
| − | | | |
| − | <br>
| |
| − | | |
| − | <br>
| |
| − | | |
| − | <br>
| |
| − | | |
| − | <br>
| |
| − | | |
| − | <br>
| |
| − | | |
| − | <br>
| |
| − | | |
| − | <br>
| |
| − | | |
| − | <br>
| |
| − | | |
| − | <br>
| |
| − | | |
| − | '''MHP Gobecho I catchment (Ethiopia): upstream and downstream areas'''
| |
| − | | |
| − | |} | |
| − | | |
| − | <br>
| |
| − | | |
| − | === ''Upstream area''<br> ===
| |
| − | | |
| − | ==== [[:file:Questionnaire Environment Assessment related to MHP projects in Ethiopia.pdf|Questionnaire]]<br> ====
| |
| − | | |
| − | ''Name'': Gobecho catchment (upstream)…….………………………………………………………………………………………….
| |
| − | | |
| − | <br>''Power house location (in degrees)'': 6°35’29’’N 38°40’56’’E….……………………………………………………………..
| |
| − | | |
| − | <br>''Size (in ha)'': 1955………..………………………………………………………………………………………………………………………
| |
| − | | |
| − | <br>''Altitude (in m above sea level): Highest point'': 3050….… ''Lowest point'': 2600………''<br>''<br>
| |
| − | | |
| − | ''Precipitation (in mm) : annual: ''1357.0 (average for Bensadaye years 2001 – 2007)……<br> ''seasonal:''<br>
| |
| − | | |
| − | {| style="width: 768px; height: 45px" cellspacing="1" cellpadding="1" border="1"
| |
| − | |-
| |
| − | | Month<br>
| |
| − | | JAN<br>
| |
| − | | FEB<br>
| |
| − | | MAR<br>
| |
| − | | APR<br>
| |
| − | | MAY<br>
| |
| − | | JUN<br>
| |
| − | | JUL<br>
| |
| − | | AUG<br>
| |
| − | | SEP<br>
| |
| − | | OCT<br>
| |
| − | | NOV<br>
| |
| − | | DEC<br>
| |
| − | |-
| |
| − | | Precipitation<br>
| |
| − | | 40.3<br>
| |
| − | | 32.1<br>
| |
| − | | 82.7<br>
| |
| − | | 174.3<br>
| |
| − | | 197.6<br>
| |
| − | | 120.4<br>
| |
| − | | 110.3<br>
| |
| − | | 115.7<br>
| |
| − | | 147.6<br>
| |
| − | | 179.3<br>
| |
| − | | 97.2<br>
| |
| − | | 59.4<br>
| |
| − | |}
| |
| − | | |
| − | <br>
| |
| − | | |
| − | ''Discharge (in m<sup>3</sup>/s) : ''(fill in discharge data from at least two years) <br>''Year 1: Annual average:'' 0.38…………<br> ''Seasonal:''
| |
| − | | |
| − | {| style="width: 768px; height: 45px" cellspacing="1" cellpadding="1" border="1"
| |
| − | |-
| |
| − | | Month<br>
| |
| − | | JAN<br>
| |
| − | | FEB<br>
| |
| − | | MAR<br>
| |
| − | | APR<br>
| |
| − | | MAY<br>
| |
| − | | JUN<br>
| |
| − | | JUL<br>
| |
| − | | AUG<br>
| |
| − | | SEP<br>
| |
| − | | OCT<br>
| |
| − | | NOV<br>
| |
| − | | DEC<br>
| |
| − | |-
| |
| − | | Discharge<br>
| |
| − | | 0.246<br>
| |
| − | | 0.224<br>
| |
| − | | 0.239<br>
| |
| − | | 0.311<br>
| |
| − | | 0.437<br>
| |
| − | | 0.409<br>
| |
| − | | 0.404<br>
| |
| − | | 0.426<br>
| |
| − | | 0.496<br>
| |
| − | | 0.563<br>
| |
| − | | 0.463<br>
| |
| − | | 0.312<br>
| |
| − | |}
| |
| − | | |
| − | <br>
| |
| − | | |
| − | ''Year 2: Annual average:'' 0.45………<br> ''Seasonal:''
| |
| − | | |
| − | {| style="width: 768px; height: 45px" cellspacing="1" cellpadding="1" border="1"
| |
| − | |-
| |
| − | | Month<br>
| |
| − | | JAN<br>
| |
| − | | FEB<br>
| |
| − | | MAR<br>
| |
| − | | APR<br>
| |
| − | | MAY<br>
| |
| − | | JUN<br>
| |
| − | | JUL<br>
| |
| − | | AUG<br>
| |
| − | | SEP<br>
| |
| − | | OCT<br>
| |
| − | | NOV<br>
| |
| − | | DEC<br>
| |
| − | |-
| |
| − | | Discharge<br>
| |
| − | | 0.55<br>
| |
| − | | 0.36<br>
| |
| − | | 0.46<br>
| |
| − | | 0.23<br>
| |
| − | | 0.64<br>
| |
| − | | 0.71<br>
| |
| − | | 0.35<br>
| |
| − | | 0.58<br>
| |
| − | | 0.4<br>
| |
| − | | 0.45<br>
| |
| − | | 0.42<br>
| |
| − | | 0.29<br>
| |
| − | |}
| |
| − | | |
| − | <br>''Agroclimatic Zone'': tepid to cool humid mid highlands……………………………………………………………..
| |
| − | | |
| − | <br>''What do you know about the historic land use?'' Widely covered with forest…………………………….…………<br>
| |
| − | | |
| − | <br>
| |
| − | | |
| − | ''Have there been any changes in land use?'' Yes…………………………………………………………………………………….
| |
| − | | |
| − | <br>''What kind of?'' Forest → deforestation → agricultural and pastoral use………………………………………………
| |
| − | | |
| − | <br>''When and why?'' About 40 years ago people started to settle in the area..………………………………………….
| |
| − | | |
| − | <br>
| |
| − | | |
| − | ''What do you know about the future land use, do you know of any planned changes?'' ………………………..<br>MHP implementation → population growth around powerhouse likely……………………………………………….
| |
| − | | |
| − | <br>
| |
| − | | |
| − | ''Since when is the area populated?'' Since about 40 years………………………………………………………………………
| |
| | | | |
| − | <br>''What is the current population of the area?'' About 3000…………………………………………………………………….
| |
| − |
| |
| − | <br>''Are there any major changes in population (due to migration and/or fertility rate)? ''Population figure are rising due to high fertility rate…………………………………………………………………………………<br>
| |
| − |
| |
| − | <br>
| |
| − |
| |
| − | ==== [[:file:Checklist Environment Assessment related to MHP projects in Ethiopia.pdf|Checklist]]<br> ====
| |
| − |
| |
| − | === ''Downstream area''<br> ===
| |
| − |
| |
| − | ==== [[:file:Questionnaire Environment Assessment related to MHP projects in Ethiopia.pdf|Questionnaire]]<br> ====
| |
| − |
| |
| − | ''Name:'' Gobecho catchment (downstream)…….…………………………………………………………………………………….<br>
| |
| − |
| |
| − | <br>
| |
| − |
| |
| − | ''Power house location (in degrees):'' 6°35’29’’N 38°40’56’’E….……………………………………………………………..<br>
| |
| − |
| |
| − | <br>
| |
| − |
| |
| − | ''Size (in ha):'' 1127………..………………………………………………………………………………………………………………………
| |
| − |
| |
| − | <br>
| |
| − |
| |
| − | ''Altitude (in m above sea level): Highest point:'' 2600….… ''Lowest point:'' 2317………
| |
| − |
| |
| − | <br>
| |
| − |
| |
| − | ''Precipitation (in mm) : annual: ''1357.0 (average for Bensadaye years 2001 – 2007)……<br> ''seasonal:''<br>
| |
| − |
| |
| − | {| style="width: 768px; height: 45px" cellspacing="1" cellpadding="1" border="1"
| |
| − | |-
| |
| − | | Month<br>
| |
| − | | JAN<br>
| |
| − | | FEB<br>
| |
| − | | MAR<br>
| |
| − | | APR<br>
| |
| − | | MAY<br>
| |
| − | | JUN<br>
| |
| − | | JUL<br>
| |
| − | | AUG<br>
| |
| − | | SEP<br>
| |
| − | | OCT<br>
| |
| − | | NOV<br>
| |
| − | | DEC<br>
| |
| − | |-
| |
| − | | Precipitation<br>
| |
| − | | 40.3<br>
| |
| − | | 32.1<br>
| |
| − | | 82.7<br>
| |
| − | | 174.3<br>
| |
| − | | 197.6<br>
| |
| − | | 120.4<br>
| |
| − | | 110.3<br>
| |
| − | | 115.7<br>
| |
| − | | 147.6<br>
| |
| − | | 179.3<br>
| |
| − | | 97.2<br>
| |
| − | | 59.4<br>
| |
| − | |}
| |
| − |
| |
| − | <br>
| |
| − |
| |
| − | ''Discharge (in m<sup>3</sup>/s) : ''(fill in discharge data from at least two years) <br>''Year 1: Annual average:'' 0.38…………<br> ''Seasonal:''
| |
| − |
| |
| − | {| style="width: 768px; height: 45px" cellspacing="1" cellpadding="1" border="1"
| |
| − | |-
| |
| − | | Month<br>
| |
| − | | JAN<br>
| |
| − | | FEB<br>
| |
| − | | MAR<br>
| |
| − | | APR<br>
| |
| − | | MAY<br>
| |
| − | | JUN<br>
| |
| − | | JUL<br>
| |
| − | | AUG<br>
| |
| − | | SEP<br>
| |
| − | | OCT<br>
| |
| − | | NOV<br>
| |
| − | | DEC<br>
| |
| − | |-
| |
| − | | Discharge<br>
| |
| − | | 0.246<br>
| |
| − | | 0.224<br>
| |
| − | | 0.239<br>
| |
| − | | 0.311<br>
| |
| − | | 0.437<br>
| |
| − | | 0.409<br>
| |
| − | | 0.404<br>
| |
| − | | 0.426<br>
| |
| − | | 0.496<br>
| |
| − | | 0.563<br>
| |
| − | | 0.463<br>
| |
| − | | 0.312<br>
| |
| | |} | | |} |
| | | | |
| − | <br> | + | <br/> |
| | | | |
| − | ''Year 2: Annual average:'' 0.45………<br> ''Seasonal:''
| + | {| cellspacing="1" cellpadding="1" border="0" style="width: 200px" class="FCK__ShowTableBorders" |
| − | | |
| − | {| style="width: 768px; height: 45px" cellspacing="1" cellpadding="1" border="1" | |
| | |- | | |- |
| − | | Month<br> | + | | [[File:Example work map.png|thumb|center|286px|Example work map.png]] |
| − | | JAN<br>
| + | | <br/> |
| − | | FEB<br>
| |
| − | | MAR<br>
| |
| − | | APR<br>
| |
| − | | MAY<br>
| |
| − | | JUN<br>
| |
| − | | JUL<br>
| |
| − | | AUG<br>
| |
| − | | SEP<br>
| |
| − | | OCT<br>
| |
| − | | NOV<br>
| |
| − | | DEC<br>
| |
| − | |-
| |
| − | | Discharge<br>
| |
| − | | 0.55<br>
| |
| − | | 0.36<br> | |
| − | | 0.46<br> | |
| − | | 0.23<br> | |
| − | | 0.64<br> | |
| − | | 0.71<br>
| |
| − | | 0.35<br> | |
| − | | 0.58<br>
| |
| − | | 0.4<br>
| |
| − | | 0.45<br>
| |
| − | | 0.42<br>
| |
| − | | 0.29<br>
| |
| | |} | | |} |
| | | | |
| − | <br> | + | <br/> |
| − | | |
| − | ''Agroclimatic Zone:'' tepid to cool humid mid highlands……………………………………………………………..
| |
| − | | |
| − | <br>''What do you know about the historic land use?'' Widely covered with forest…………………………….…………
| |
| − | | |
| − | <br>
| |
| − | | |
| − | ''Have there been any changes in land use?'' Yes…………………………………………………………………………………….
| |
| − | | |
| − | <br>''What kind of?'' Forest → deforestation → agricultural and pastoral use………………………………………………
| |
| − | | |
| − | <br>''When and why? ''About 40 years ago people started to settle in the area..………………………………………….<br>
| |
| − | | |
| − | <br>
| |
| − | | |
| − | ''What do you know about the future land use, do you know of any planned changes?'' ………………………..<br>MHP implementation → population growth around powerhouse likely……………………………………………….
| |
| − | | |
| − | <br>
| |
| − | | |
| − | ''Since when is the area populated?'' Since about 40 years………………………………………………………………………
| |
| − | | |
| − | <br>''What is the current population of the area?'' About 3000…………………………………………………………………….
| |
| | | | |
| − | <br>''Are there any major changes in population (due to migration and/or fertility rate)?'' Population figure are rising due to high fertility rate……………………………………………………………………………………………………….. <br> | + | <br/> |
| | | | |
| − | <br>
| + | = Identification of Major Problems and Problem Areas = |
| | | | |
| − | ==== [[:file:Checklist Environment Assessment related to MHP projects in Ethiopia.pdf|Checklist]]<br> ====
| + | Once the biophysical and socio-economic survey is done, the [[Watershed_Planning_Team_related_to_Micro-hydro_Power_(MHP)_Projects_in_Ethiopia|watershed planning team]] should analyze the collected data carefully in order to assess major problems and problem areas within the watershed. Identified problems should be ranked according to priority. |
| | | | |
| − | [[Image:Degradation downstream.jpg|700px|Degradation downstream.jpg]]
| + | <u>Note:</u> (1) identified problems can be causes and features of degradation as well as inappropriate land use techniques and (2) checklist classification might help with ranking. |
| | | | |
| − |
| + | <br/> |
| | | | |
| − | '''Landslides'''
| + | <u>Results of the environment assessment should be:</u> |
| | | | |
| − | '''[[Image:Landslides downstream.jpg|500px|Landslides downstream.jpg]]''' | + | a) a '''list of the identified problems of the watershed ranked by priority '''and |
| | | | |
| − | '''Cattlestep''' | + | b) a '''map and/or several thematic maps''', showing the watershed’s environmental condition and problem areas. |
| | | | |
| − | '''[[Image:Cattlestep downstream.jpg|500px|Cattlestep downstream.jpg]]'''
| + | <br/> |
| | | | |
| − | More than one cross is possible. Table above should be filled in according to prevailing color. In doubt cross the darker one.
| + | = Example: Environment Assessment for the Gobecho and the Hagara Sodicha Catchment (Ethiopia)<br/> = |
| | | | |
| − |
| + | -> [[Micro_Hydro_Power_(MHP)_-_Ethiopia,_Gobecho_I|Micro Hydro Power (MHP) - Ethiopia, Gobecho I]], [[Micro_Hydro_Power_(MHP)_-_Ethiopia,_Gobecho_II|Micro Hydro Power (MHP) - Ethiopia, Gobecho II]] |
| | | | |
| − | '''Gully erosion'''
| + | -> [[Micro_Hydro_Power_(MHP)_-_Ethiopia,_Hagara_Sodicha|Micro Hydro Power (MHP) - Ethiopia, Hagara Sodicha]] |
| | | | |
| − | [[Image:Gullyerosion downstream.jpg|500px|Gullyerosion downstream.jpg]]
| + | <br/> |
| | | | |
| − |
| + | <u>A detailed depiction of the application of Environment Assessment in MHP catchments in Ethiopia can be found here:</u> |
| | | | |
| − | '''Badlands<br>'''Low = < 0.25 ha Medium = 0.25 – 0.5 ha High = > 0.5 ha
| + | [[File:Environmental Assessment of Micro Hydropower Plants in Ethiopia.pdf|thumb|left|180px]]. |
| | | | |
| − | <br> | + | <br/> |
| | | | |
| − | '''Alternation of discharge<br>'''(Difference between annual discharge rates in % (use average difference if data from more than two years is available)<br>Low = < 10 Medium = 10 - 25 High = >25<br>
| + | == List of Identified Problems == |
| | | | |
| − | [[Image:Landuse downstream.jpg|700px|Landuse downstream.jpg]] | + | [[File:EA List of identified problems.jpg|thumb|center|685px|EA List of identified problems.jpg]] |
| | | | |
| − |
| + | == Maps == |
| | | | |
| − | (*)list crop types according to quantity
| + | <u>Examples of hand-drawn maps of the Gobecho catchment:</u> |
| | | | |
| − | {| cellspacing="1" cellpadding="1" width="100" border="1" | + | {| cellspacing="1" cellpadding="1" border="0" style="width: 820px; height: 440px" class="FCK__ShowTableBorders" |
| − | |-
| |
| − | | Enset
| |
| | |- | | |- |
| − | | Coffee | + | | style="width: 318px" | '''[[File:Gobecho watershed deliniation.jpg|thumb|center|258px|Gobecho watershed deliniation.jpg]]'''<br/> |
| | + | | style="width: 438px" | [[File:Map section.jpg|thumb|center|183px|Map section.jpg]]<br/> |
| | |- | | |- |
| − | | | + | | style="width: 318px" | <br/> |
| − | |-
| + | | style="width: 438px" | <br/> |
| − | | | |
| − | |- | |
| − | | | |
| | |} | | |} |
| | | | |
| − | <br> | + | <br/> |
| | | | |
| − | (**)list crop types according to quantity
| + | <u>Examples of GIS-based maps of the Gobecho catchment:</u> |
| | | | |
| − | {| cellspacing="1" cellpadding="1" width="100" border="1" | + | {| cellspacing="1" cellpadding="1" border="0" align="left" style="width: 100%" class="FCK__ShowTableBorders" |
| | |- | | |- |
| − | | Maize | + | | [[File:Map Gobecho downstream.jpg|thumb|center|200px|Map Gobecho downstream.jpg]]<br/> |
| | + | | [[File:Map Gobecho upstream.jpg|thumb|center|200px|Map Gobecho upstream.jpg]]<br/> |
| | |- | | |- |
| − | | Teff | + | | <br/> |
| − | |-
| + | | <br/> |
| − | | Barley
| |
| − | |-
| |
| − | | Beans
| |
| − | |-
| |
| − | | | |
| | |} | | |} |
| | | | |
| − | <br> | + | <br/> |
| | | | |
| − |
| + | <br/> |
| | | | |
| − | (***)cross the prevailing forest type/use
| + | <br/> |
| | | | |
| − | [[Image:Foresttype downstream.jpg|300px|Foresttype downstream.jpg]]
| + | <br/> |
| | | | |
| − |
| + | <br/> |
| | | | |
| − | '''Cultivation, Grazing, Forest<br>'''(in % of the respective area assessed)<br>Low = < 5 Medium = 5 – 25 High = >25
| + | <br/> |
| | | | |
| − |
| + | = Further Information = |
| | | | |
| − | [[Image:Naturalresources downstream.jpg|700px|Naturalresources downstream.jpg]]
| + | *[[Portal:Hydro|Hydro Portal on energypedia]] |
| − | | + | *[[Ethiopia_Energy_Situation|Ethiopia Energy Situation]] |
| − |
| |
| − | | |
| − |
| |
| − | | |
| − | '''Slope<br>'''(Average, in %)<br>Low = < 5 Medium = 5 – 15 High = > 15
| |
| − | | |
| − | <br>'''Wetlands<br>'''(in % of the respective area assessed)<br>Low = < 1 Medium = 1 – 5 High = > 5
| |
| − | | |
| − | <br>'''Springs<br>'''(Average number per km²)<br>Low = < 1 Medium = 1 – 3 High = > 3
| |
| − | | |
| − | <br>(****) cross the prevailing spring type
| |
| − | | |
| − | [[Image:Springtype downstream.jpg|300px|Springtype downstream.jpg]]<br><br>'''Flood events<br>'''(Annually)<br>Low = 1 Medium = 2 High = >2
| |
| − | | |
| − | <br>'''Water ways (with and without vegetation buffer)<br>'''(in % of total length)<br>Low = < 25 Medium = 25 – 50 High = > 50<br>
| |
| − | | |
| − | [[Image:Mitigation downstream.jpg|700px|Mitigation downstream.jpg]]
| |
| − | | |
| − |
| |
| − | | |
| − | [[Image:Humansettlement downstream.jpg|700px|Humansettlement downstream.jpg]]
| |
| − | | |
| − |
| |
| − | | |
| − | (Referring to the entire area)<br>Low = 1 Medium = 2 High = > 2<br>
| |
| − | | |
| − | <br>
| |
| − | | |
| − | Red and green colors in the tables indicate, whether a low or high occurrence of the respective feature is rather positive or negative (<span style="color: #ff0000">Red </span>= negative, <span style="color: #008000">Green </span>= positive).<br>Note: The colors only give an indication, nonetheless it should be noted that for example forest which is used for timber and firewood is better than no forest for the environment condition of the watershed. <br>
| |
| − | | |
| − |
| |
| − | | |
| − | <br>
| |
| − | | |
| − | === ''Map''<br> ===
| |
| − | | |
| − | {| class="FCK__ShowTableBorders" style="width: 820px; height: 440px" cellspacing="1" cellpadding="1" border="0"
| |
| − | |-
| |
| − | | '''[[Image:Gobecho watershed deliniation.jpg|272x444px|Gobecho watershed deliniation.jpg]]<br>'''
| |
| − | | [[Image:Map section.jpg|484x443px|Map section.jpg]]<br>
| |
| − | |-
| |
| − | | '''MHP Gobecho I catchement delinitation'''<br>
| |
| − | | '''MHP Gobecho I upstream catchment work map section<br>'''
| |
| − | |}
| |
| | | | |
| − | <br> | + | <br/> |
| | | | |
| − | == References ==
| + | = References<br/> = |
| | | | |
| | <references /> | | <references /> |
| | | | |
| − | [[Category:Hydro]] [[Category:Ethiopia]] | + | [[Category:Ethiopia]] |
| | + | [[Category:Micro_Hydro]] |
| | + | [[Category:Impacts_Environmental]] |
| | + | [[Category:Questionnaires_/_Interviews]] |
| | + | [[Category:Hydro]] |
Overview
► Watershed Action Planning related to Micro-hydro Power (MHP) Projects in Ethiopia
Environment Assessment
The first step towards a watershed action plan is an Environment Assessment, which includes the selection, compilation and mapping of data on the watershed, with the aim to show its current environmental condition. The implementation of Environment Assessment helps to identify any existing environmental impacts and thus what mitigation techniques need to be implemented within the watershed action plan.
Biophysical and Socio-economic Survey
In order to assess as much environmental information on the target area as possible, it is important to consider both, biophysical as well as socio-economic features of the watershed. The most effective way to do so is a combination of landscape observation, interviews and mapping. A checklist and questionnaire help to note down the findings of the landscape observation and the interviews. Maps help to illustrate the environmental condition of the watershed and thus to locate points of interest such as degradation features, wetlands and spring areas.
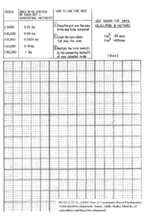
How to Use the Questionnaire and the Checklist
The checklist and the questionnaire include a variety of questions and features, all of them having different answer modalities (ranging from qualitative to quantitative). In order to fill in the questionnaire and the checklist it is thus of great importance to not only observe the landscape and to take measurements but also to interview people (inhabitants and/or officials) when required. To make the results of the survey more detailed, the watershed should roughly be divided into (at least) two parts: the upstream and the downstream region. Depending on the size of the watershed, further subdivision might be useful. For each sub-region the questionnaire and the checklist should be filled in.
Checklist:
|
Questionnaire:
|
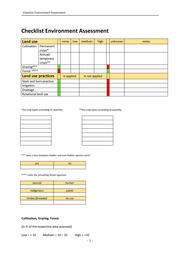 Checklist Environment Assessment related to MHP projects in Ethiopia.pdf |
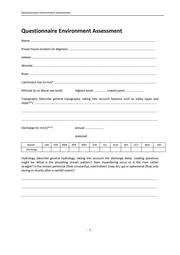 Questionnaire Environment Assessment related to MHP projects in Ethiopia.pdf |
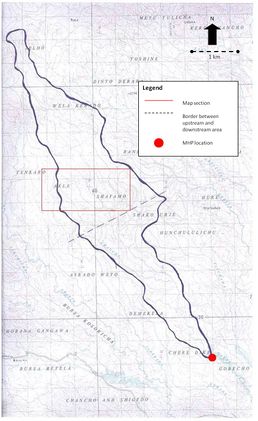
How to Draw a Map
To delineate the watershed boundaries, use a topographic map (scale 1: 50 000) of the area and enlarge it once (1: 25 000) or twice (1: 12 500). The outlet should be the location of the Micro-hydro Power (MHP) station (see fig. 3).
To calculate the area of the watershed, use a grid square (print it on a foil and lay it over the map, see fig. 4). In order to map parts of the watershed in greater detail, the map can be further enlarged[1].
Once the base map is drawn in accordance with the work scale (depending on how detailed the map must be), all information of interest (land use, land cover, springs, wetlands, rivers, degraded areas, infrastructure, slopes, soil texture and other) can be filled in (see fig.5). If there is no GPS available, landmarks such as rivers that are found on the topographic map can be used for orientation. Either all information can be noted on one map, or several thematic maps can be created, showing for example only springs and wetlands or degraded areas.
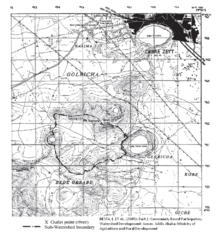 Watershed Deliniation Topographic Map.png |
|
 Grid Square for Area Calculation.png |
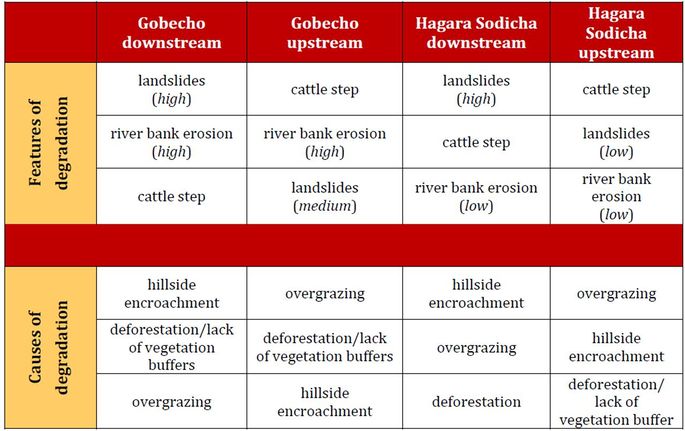
Identification of Major Problems and Problem Areas
Once the biophysical and socio-economic survey is done, the watershed planning team should analyze the collected data carefully in order to assess major problems and problem areas within the watershed. Identified problems should be ranked according to priority.
Note: (1) identified problems can be causes and features of degradation as well as inappropriate land use techniques and (2) checklist classification might help with ranking.
Results of the environment assessment should be:
a) a list of the identified problems of the watershed ranked by priority and
b) a map and/or several thematic maps, showing the watershed’s environmental condition and problem areas.
Example: Environment Assessment for the Gobecho and the Hagara Sodicha Catchment (Ethiopia)
-> Micro Hydro Power (MHP) - Ethiopia, Gobecho I, Micro Hydro Power (MHP) - Ethiopia, Gobecho II
-> Micro Hydro Power (MHP) - Ethiopia, Hagara Sodicha
A detailed depiction of the application of Environment Assessment in MHP catchments in Ethiopia can be found here:
.
List of Identified Problems
EA List of identified problems.jpg
Maps
Examples of hand-drawn maps of the Gobecho catchment:
 Gobecho watershed deliniation.jpg
|
|
|
|
Examples of GIS-based maps of the Gobecho catchment:
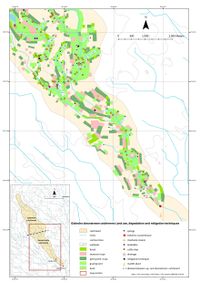 Map Gobecho downstream.jpg
|
|
|
|
Further Information
References
- ↑ DESTA, L. ET AL. (2005): Part 2: Community Based Participatory Watershed Development: Annex. Addis Ababa: Ministry of Agriculture and Rural Development.