Click here to register!
Market Development Scorecard
- If you know how to use the scorecard, you can jump directly to the download section.
Introduction
Energising Development (EnDev) developed a tool to investigate, measure, and subsequently be able to effectively stimulate the market development for modern energy products and services. It offers:
- a starting point for determining the level of market development;
- a scorecard with 19 market development indicators that can be tracked over time;
- a guideline for developing baseline scenarios and predictions on how markets could develop; and for tracking actual developments against those predictions;
Tracking market development with the scorecard complements EnDev’s monitoring system, and thus serves to take informed decisions to enhance energy access markets. In addition, the state of a market, determined by the use of the tool, will be used to define values for the various correction factors in EnDev’s outcome monitoring.
To assess market development helps to recognise changes, trends and gaps. Those might indicate the project’s need to redirect its attention / change its activities: e.g. strengthening business networks in order to reinforce supply or pulling out of a region because a market appears to be sufficiently mature.
Nevertheless, the complexity of markets and especially the wide range of potential factors and players that influence its nature and behaviour render the task of measuring these influences not an easy one. As the name indicates, market development is a changing process and its results take time to materialise and be measurable.
In order to analyse markets, the energy market scorecard offers a pathway to systematically collect market data.
The tool is described in 6 sections:
- Section 1 summarizes concepts of market theory and the main market development phases
- Section 2 includes important definitions and considerations for the energy market scorecard
- Section 3 describes the scorecard and its use to track energy access market changes with 19 indicators and benchmarks for each phase of market development
- Section 4 explains how to use the scorecard based on the lessons learnt
- Section 5 contains a Glossary of terms used within the tool.
- Section 6 contains relevant references.
Market Theory and Market Development
The market system
The ‘market’ may be defined as a “system for the voluntary exchange of certain economic goods and services between individuals or groups, according to rules”.[1] It can be a physical or abstract place where forces of demand and supply operate to allocate resources in (ideally) the most efficient way possible.
As to demand, it describes the desire of people to acquire a certain product or service, ruled by their ability and willingness to pay. Supply on the other hand is the ability of businesses to provide these products and services, ruled by access to information and resources.
Markets thus are complex systems driven by multiple players and influencing agents. The core of the market consists of the transactions between demand (consumers) and supply (businesses) sides whose aim is to maximise their own benefit. The efficiency of what happens in the core depends on the so-called enabling environment, the set of rules and regulations imposed on the transactions by (mostly) government actors as well as potentially stimulating instruments like subsidies, financing schemes etc.
On a global scale, the potential demand for energy access products and services is enormous. IEA estimates that around 1.1 billion people worldwide do not have access to electricity and more than 2.8 billion people cook on traditional and inefficient stoves or fireplaces.[2] This gives room for a growing supply of modern energy access products and services. The dissemination must be accompanied by a range of services that ensure the proper installation, functionality, maintenance and use. Along with the supply of and demand for energy access products and services, a truly “enabling” environment is also needed for market development.
Market development
When a new product enters a market or an existing product enters an unexploited market, it takes time until its full market potential is reached. The process of market development can be broadly divided into six phases.
Figure 1: General market development phases[3]


The most challenging period of market development is the transition from the pioneering to the expansion phase. When a product is introduced into a market for the first time, it is hard to find entrepreneurs that are willing to promote a product for which there is no palpable market yet. It becomes clear that the characteristics and strategies of the suppliers have a significant influence on how the markets grow.
Most economies today fall into the category of regulated market economies. In a regulated market economy, market forces are influenced through government intervention. Although different perspectives exist as to how strong a government’s role should be, all regulated market economies agree on the same common belief that markets can be actively shaped through interventions from the government. This principle builds on the notion of market failure: the assumption that markets are imperfect, i.e. goods and services are not allocated efficiently due to imperfect competition, externalities and information asymmetries, among other factors. Governments aim at removing these market failures through targeted instruments (e.g. taxes, subsidies, price control, etc.).
Similarly, development cooperation operates according to the principle of market transformation. By removing market barriers, international cooperation and donor agencies aim at unlocking demand and promoting supply, thus contributing to an accelerated development of key sectors. The intensity and focus of market transformation measures depend on the targeted markets’ development phase. Naturally, the highest efforts are required in the early market development phases (see Figure 1) when demand is low and market hurdles abundant and manifold. In contrast, when a market reaches the end of the expansion phase, it is an indication to withdraw the transformation measures set up at the early phases.
Therefore, the role of development cooperation agencies is not to be a constant (subsidising) presence in market systems but rather “to be an external catalyst for change – addressing the constraints that prevent markets from working effectively”.[4] A programme can successfully support market transformation by:
- demonstrating that there is a market for modern energy access products and services;
- demonstrating the viability, reliability and quality of modern energy access products and services;
- supporting the creation of businesses and supply chains for modern energy access products and services;
- creating a critical market volume that generates the necessary economies of scale to achieve significant price breaks and so unchain further demand that generates attractive levels of turnover and profits for businesses;
- contributing to (lobbying for) the establishment of the required enabling environment to boost the market, such as subsidies during the early phases of market development and consumer financing options for later stages;
- supporting local and national governments in shaping energy access and renewable energy policies in such a way that they contribute to a truly enabling environment for investment;
- creating a market that serves the energy poor and that will, after a certain point, no longer be dependent on donor funding or subsidies.
The scorecard may help EnDev throughout a projects’ cycle to identify where to put its efforts during the build-up of a market as well as eventually determine the point in time when a market no longer requires support to trigger development, i.e. when to end its intervention.
Definitions and Considerations for the Energy Market Scorecard
To capture the factors affecting supply, demand and enabling environment, the scorecard suggests a set of 19 indicators which however are not meant to be exhaustive and may be complemented (and/or adapted) as market development monitoring is further explored in the context of EnDev.
The scorecard aims to provide an as broad as possible overview of options to measure and track changes in market development. Thus, in order to implement the scorecard, the following definitions and considerations should be taken into account.
Indicator’s definitions
Each of the 19 indicators has been defined below in order to identify the variables to measure it.
|
Indicator |
Definition |
|
S1 Suppliers |
|
|
S2 Sales volume |
|
|
S3 Prices, cost and profit |
|
|
S4 Supply chain (development) |
|
|
S5 Value chain development |
|
|
S6 Business networks |
|
|
S7 Warranties |
|
|
S8 Entrepreneurial skills |
|
|
Indicator |
Definition |
|
D1 Product and service diversity |
|
|
D2 Market penetration |
|
|
D3 Willingness to pay |
|
|
D4 Systems in use |
|
|
D5 Replacement and repair |
|
|
D6 Consumer awareness and perception |
|
|
Indicator |
Definition |
|
E1 Policy |
|
|
E2 Access to finance |
|
|
E3 Quality regulations, norms and standards |
|
|
E4 Market information |
|
|
E5 Expertise development |
|
Terminology of the Energy Market Scorecard
Throughout this article and throughout the tool the five terms listed in the table below are used in a meaning specific for the tool.
|
Term |
Explanation |
|
Market system |
All market participants of demand and supply side, including the enabling environment. |
|
Market Development Phase |
During its development a market passes consecutively through the following 6 ’market development phases’:
The scorecard – for reasons explained below – only considers the first four of these phases. |
| Indicator |
The measurable aspects that are included in the scorecard and can be tracked over time. The scorecard includes 19 indicators. For each indicator, there are one or several variables with specific benchmarks. |
| Variable |
A variable is a characteristic of the indicator observed that assumes benchmarks (values) assigned according to the corresponding market phase. |
| Benchmarks |
Benchmarks are simplified predictions on how the market develops; one or several variables per indicator present specific benchmarks for each market phase. Benchmarks are the values that a variable can have. |
With these definitions, the scorecard’s logic is as follows: Each variable (i.e. “sub-indicator”) of the 19 indicators meets a benchmark (i.e. “minimum value”) of one of the market phases. While assessing the market, the benchmark that is still met by current situation should be chosen indicating a specific market phase. i.e. for the indicator E5 Expertise development in the market development phase ‘expansion’, the variable (i.e. “sub-indicator”) service of the indicator E5-Expertise Development has a benchmark (i.e. “minimum value”) of “Service easily available”.
Indicator |
⇒ |
Variable |
⇒ |
Benchmark (expansion phase) |
E5 - Expertise Development |
Service |
Service easily available |
Importance of country context
Before using the scorecard to track changes in market development, a project needs to consider their country context in order to identify the prevailing market phase for each indicator. Even when no baseline or reference values are available, projects can perform a quick structured assessment using the scorecard based on their own experience including what they have observed over time.
Stages of market development considered in the tool
While the framework suggests that demand growth and supply chain development follow a predefined path, the development of (energy access) markets is mostly not linear. Although some (energy access) markets have typically evolved progressively along the path (Figure 1), there is no guarantee that a linear progression takes place in every case[5] and adaptations to projects’ country contexts will be necessary, though kept minimal in order to ensure comparability.
Ideally, the scorecard should enable to define a baseline and make predictions about how the market might develop in its particular context. In addition, as the market evolves, it allows to track actual development compared with the scorecard’s benchmarks.
The tool only includes the first four market phases as it can be safely assumed that when an energy access market reaches saturation EnDev has long retired its support.
Figure 2: Market development phases.[6]

Challenges while measuring energy access market development
The first challenge faced by programmes that aim at stimulating market development is inherent to every change process: while there is a need to measure and demonstrate progress during the course of a project, impacts generally are only visible after longer periods of time, often after a project ends. Hence, while M&E systems can be useful to track short-term trends and provide regular feedback to market actors, there must be a sufficient time horizon left to assess the benefits arising from market facilitation.[7]
Furthermore, measuring market development impacts is not easy due to its complex correlation of “many qualitative dimensions of many forms”[8]. Assumptions at project start might turn out different. Therefore, monitoring systems should be flexible enough to allow for adaptations of the underlying assumptions during the project time when market development paths become evident.
It is also important to keep in mind that while M&E measures might be able to show market changes and to a certain degree the influence of the project/programme on those changes, proving a direct contribution (causality) will be hardly possible. Another difficulty when analysing market development is that vital data is often either not available or not accessible.
EnDev’s Energy Market Scorecard
Energy Market Scorecard
The scorecard combines the characteristics of the energy access market system with a set of proposed benchmarks of market development. This is based on Eichner’s (2002) market development model and the World Bank’s (2003) definitions of the different market development phases, which are based on Roger’s (1962) theory of diffusion.[9]
Market development is observed from the three different perspectives, based on the market system characteristics: supply side, demand side and enabling environment. Each of these consists of a set of indicators. Changes in these indicators can be tracked over time and can thus provide a dynamic picture of the state and the development path of a market. One indicator alone would give a rather poor feedback on market development. It is the combination of different indicators and their behaviour over time that provides a better picture of the whole system, including inter-linkages and trade-offs among various dimensions of market development, as well as the longer-term implications of current interventions.
Every indicator has one or more variables, each of which presents a benchmark for every market development phase considered. The proposed benchmarks are an attempt to establish a point of reference against which EnDev projects can gauge the development process of the energy access market within which they operate. The benchmarks are quantitative or qualitative, or both, and refer to conditions that are characteristic for each stage of market development for the variable concerned.
To provide a certain degree of structure, the proposed indicators are grouped in supply side, demand side and enabling environment. Detailed descriptions of the indicators (definition, the main OCS data requirements, relevance for market development, measuring method, limitations and linkages to other indicators) are available in Annex I.
It is important to keep in mind that the same value for a given market development indicator does not necessarily mean the same thing for two different countries. The meaning will depend on the state of development of each country, the nature of its economy, its geography, the availability of resources, etc. and needs to be interpreted in connection with other country-based indicators. Nonetheless, the status of the respective market phase can be compared for the EnDev country projects (although they might be classified due to different values /benchmarks).
The ultimate aim of the scorecard is not to judge in which stage of the market certain technology/country is but instead, provide an insight into those aspects (indicators) that require attention in order to further develop the market for modern energy access products and services.
Table 4: Energy Market Scorecard – Market development phases’ benchmarks for energy access technologies.
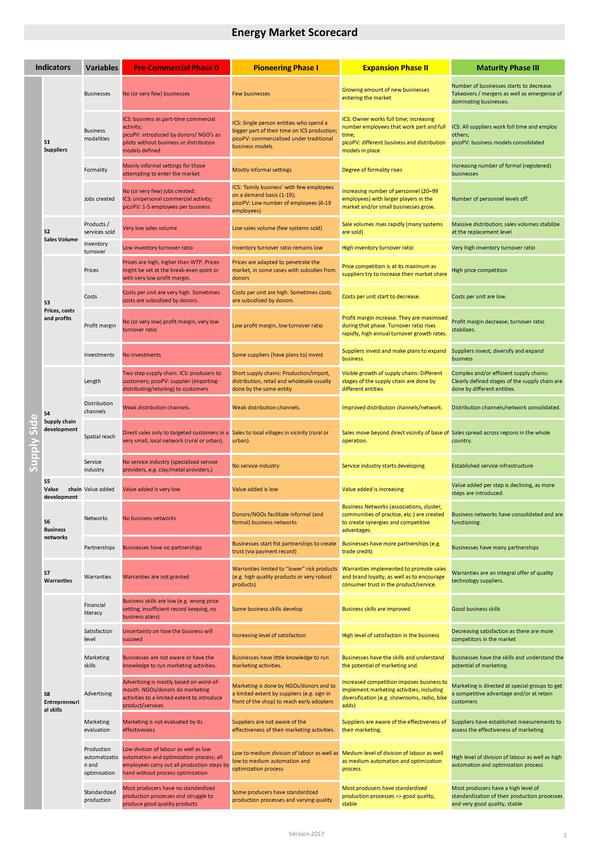
Visualisation tool:
Guidelines on How to Use the Energy Market Scorecard
This section describes how the scorecard may be used.
|
# |
Steps: How to use the Energy Market Scorecard | |
|---|---|---|
|
1 Download |
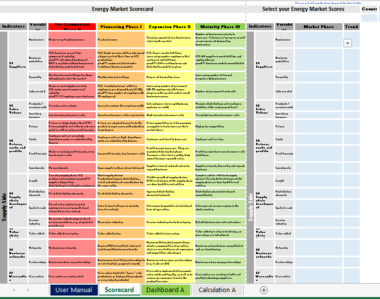
Download Excel Tool that has three tabs: User Manual, Scorecard and Dashboard.
|
|
|
2 Fill in |
The Scorecard displays Benchmarks for four market phases with colour coding for 52 variables. Fill in the Scorecard: 1. for each variable please select a market phase (Which of the benchmarks mirrors the best the current situation for that variable?)
2. for each variable please select a trend (Compared to three years ago, do you consider this a positive, negative or conflicting trend?)
3. In the fields M3, N3 and O3 please select/indicate your country, technology and year. | |
| 3 Print |
All information will be displayed automatically in the Dashboard.
|
Example:  |
|
# |
Before filling in the Scorecard: collecting DATA |
|---|---|
|
a |
A desk study should reveal all recent, relevant data that has already been gathered for the respective technology in the country. These may include market assessments, impact studies, reports of all participating organisations and institutions in the sector. |
|
b |
Additional information is gathered from relevant stakeholders via (semi-) structured interviews. Questionnaires should be designed/adopted according to the country-specific scorecard.[10] As a first step, it might be advisable to do a scoping and information mission:
|
|
c |
Report writing and analysis: The selected indicators need to be presented individually.For each indicator, a brief definition and the results should be presented, followed by a section analysing[11] the results for each indicator in more depth, taking into account limitations and linkages to other indicators. |
|
d |
Based on that report, the Market Development Scorecard can be filled out - for different points in time - to allow for comparison over time. This excel file will idenitfy for each of the 52 variables the respective market phase and a trend. |
Glossary
Terminology used in the benchmarks
In the description of the various benchmarks, economic terms need to be clarified in order to make sure that those involved in the market development assessment have the same understanding, e.g. partner organisations, country manager, country project team, interviewees and interviewer[12]. Some of these terms are:
|
Term |
Definition and explanations |
|---|---|
|
supplier |
The term suppliers, refers to all businesses on the supply side: this includes small scale producers/ manufacturers of systems or system parts, semi-industrial producers, vendors, dealers, retailers, wholesalers, distributors, systems installers (technicians), maintenance service providers (technicians). If necessary, it is important to classify and differentiate the different categories of suppliers (e.g.: Stove dealer in Kenya refers to all supply side market participants. Dealer could also only refer to the vendors of a product, not the producers). |
| warranty |
It is a guarantee provided by suppliers (may or may not be in writing) promising to repair or replace a system/ component within a specified period of time. |
| distributor |
Distributors buy a large quantity of products from the suppliers and resell them to wholesalers and retailers and rarely to customers. Distributors demand a percent of net sales for rendering the service and are actively involved in promoting the company’s product. They work with both, small and large suppliers. |
| wholesaler |
Wholesalers generally buy a large quantity of products from the distributors and resell it to the retailers. Their main source of revenue is the discount charged on products and they mainly focus on big retail houses. Unlike distributors, wholesalers do not actively promote the product and they rarely work with small suppliers. |
|
retailer |
Retailers sell the products directly to the customers and usually buy the products from a distributor or a wholesaler. In case there are no distributor or wholesaler, they buy it directly from the suppliers. |
| customers |
A customer is the person who purchases a product/ service. Although in some cases is the same person as the user (ICS: ergo the cook). Synonyms: user, consumer, beneficiary, target audience, buyer |
| market participants |
This term refers to all persons and organisations that are involved in a market: this could be on the supply side the businesses, on the demand side the customers, and on the enabling environment the NGOs, EnDev projects and Governmental officials that are involved in the market. Synonyms: stakeholder, players, actors |
|
input factors |
For production of ICS, this term refers to the raw materials that are needed to produce the device. |
|
adopter category |
The total percentage of potential consumers in a market is 100%. In market development the (potential) customers are then categorized into different categories according to market phases. |
|
supply chain |
It refers to the different actors participating in the different steps to bring products/ services to the customers (how the product/ service reaches from the manufacturer to the customer). It includes every company/ organization/ independent players; it does not consider the value added along the process. |
|
value chain |
It is the set of activities by which actors along the supply chain add value to products/ services delivered to the market: each intermediary does add value to the product/ service and to meet the customers’ expectations. |
Reference List and Footnotes
- ↑ Shel Feldman, ‘Market Transformation: Hot Topic or Hot Air?’, in ACEEE 1994 Summer Study on Energy Efficiency in Buildings (Washington, DC: American Council for an Energy-Efficient Economy, 1994), http://aceee.org/files/proceedings/1994/data/papers/SS94_Panel8_Paper05.pdf. American Council for an Energy-Efficient Economy (ACEEE). ‘Market Transformation’, 2013. http://aceee.org/portal/market-transformation.
- ↑ International Energy Agency, ed., World Energy Outlook 2015 (Paris: OECD, 2015).
- ↑ Everett. M Rogers, Diffusion of Innovations (Glencoe: The Free Press, 1962); ESDA, ‘Study on PV Market Chains in East Africa’ (Nairobi, Kenya: World Bank. Energy for Sustainable Development, Africa - ESDA, 2003); Mike Albu and Alison Griffith, ‘Mapping the Market: A Framework for Rural Enterprise Development Policy and Practice.’ (Warwickshire, UK: Practical Action, 2005), http://practicalaction.org/docs/ia2/mapping_the_market.pdf.
- ↑ Alan Gibson, ‘Taking Market Development Approaches to Financial Access’, CGAP, 21 November 2012, http://www.cgap.org/blog/taking-market-development-approaches-financial-access.
- ↑ ESDA, ‘Study on PV Market Chains in East Africa’ (Nairobi, Kenya: World Bank. Energy for Sustainable Development, Africa - ESDA, 2003)
- ↑ Based on: Stefan L. Eichner, ‘In Der Wachstumsfalle – Griechenland & Co. (Teil 3): Lösungsperspektiven Jenseits Der Wachstumslogik’, 2012, http://www.querschuesse.de/in-der-wachstumsfalle-%E2%80%93-griechenland-co-teil-3-losungsperspektiven-jenseits-der-wachstumslogik/.
- ↑ Jeanne Downing, ‘USAID’s Approach To Developing Market Systems’, CGAP Advancing Financial Inclusion to Improve the Lives of the Poor. (blog), 2013, http://www.cgap.org/blog/usaid%E2%80%99s-approach-developing-market-systems.
- ↑ Eric Martinot, ‘Monitoring and Evaluation of Market Development in World Bank-GEF Climate Change Projects’ (Washington, DC: The World Bank, 1998), http://www.martinot.info/Martinot_WB66.pdf; Kilian Reiche, Covarrubias Alvaro, and Martinot Eric, ‘Expanding Electricity Access to Remote Areas: Off-Grid Rural Electrification in Developing Countries’, Fuel 1, no. 1.2 (2000): 1–4; Eric Martinot et al., ‘Renewable Energy Markets in Developing Countries’, Annual Review of Energy and the Environment 27, no. 1 (2002): 309–48, https://doi.org/10.1146/annurev.energy.27.122001.083444.
- ↑ Based on: Stefan L. Eichner, ‘In Der Wachstumsfalle – Griechenland & Co. (Teil 3): Lösungsperspektiven Jenseits Der Wachstumslogik’, 2012, http://www.querschuesse.de/in-der-wachstumsfalle-%E2%80%93-griechenland-co-teil-3-losungsperspektiven-jenseits-der-wachstumslogik/, Everett. M Rogers, Diffusion of Innovations (Glencoe: The Free Press, 1962); ESDA, ‘Study on PV Market Chains in East Africa’ (Nairobi, Kenya: World Bank. Energy for Sustainable Development, Africa - ESDA, 2003); Mike Albu and Alison Griffith, ‘Mapping the Market: A Framework for Rural Enterprise Development Policy and Practice.’ (Warwickshire, UK: Practical Action, 2005), http://practicalaction.org/docs/ia2/mapping_the_market.pdf.
- ↑ If possible, EnDev country projects may finance a quantitative study of households and/or suppliers to analyse some aspects in more detail, in parallel to the scorecard data collection.
- ↑ The analysis needs to take into account: inflation adjustments, growth rates and possible data missing. See Annex II.
- ↑ For example, some NGOs refer to ICS production groups as their beneficiaries; others might mean the households that buy the energy devices. In addition, some ICS producers do not consider themselves as owning a business and therefore lack basic concepts as what to include in a cost calculation and how to name different aspects of their business performance.


