Namibia Energy Situation
Capital:
Windhoek
Region:
Coordinates:
22.5700° S, 17.0861° E
Total Area (km²): It includes a country's total area, including areas under inland bodies of water and some coastal waterways.
824,290
Population: It is based on the de facto definition of population, which counts all residents regardless of legal status or citizenship--except for refugees not permanently settled in the country of asylum, who are generally considered part of the population of their country of origin.
2,567,012 (2022)
Rural Population (% of total population): It refers to people living in rural areas as defined by national statistical offices. It is calculated as the difference between total population and urban population.
46 (2022)
GDP (current US$): It is the sum of gross value added by all resident producers in the economy plus any product taxes and minus any subsidies not included in the value of the products. It is calculated without making deductions for depreciation of fabricated assets or for depletion and degradation of natural resources.
12,914,932,656 (2022)
GDP Per Capita (current US$): It is gross domestic product divided by midyear population
5,031.12 (2022)
Access to Electricity (% of population): It is the percentage of population with access to electricity.
55.23 (2021)
Energy Imports Net (% of energy use): It is estimated as energy use less production, both measured in oil equivalents. A negative value indicates that the country is a net exporter. Energy use refers to use of primary energy before transformation to other end-use fuels, which is equal to indigenous production plus imports and stock changes, minus exports and fuels supplied to ships and aircraft engaged in international transport.
74.44 (2014)
Fossil Fuel Energy Consumption (% of total): It comprises coal, oil, petroleum, and natural gas products.
66.72 (2014)
Introduction
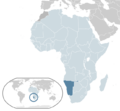
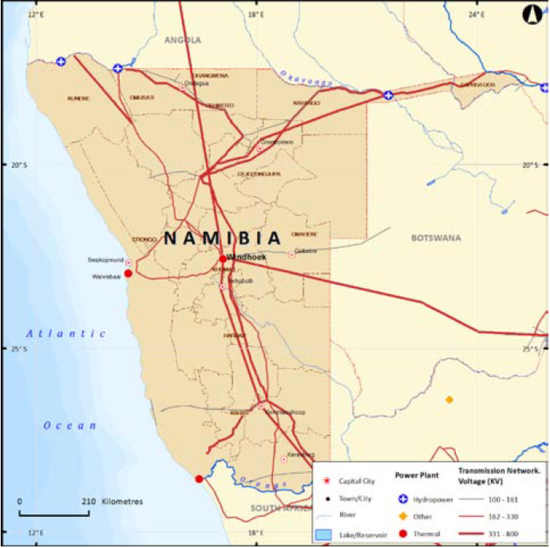
Namibia lies in the southern part of the African continent. It borders the Atlantic Ocean to the west, Angola to the north, Zambia to the north-east, Botswana to the east, and South-Africa to both south-east & south.
Energy Situation
Overview of the Country's Energy Sources
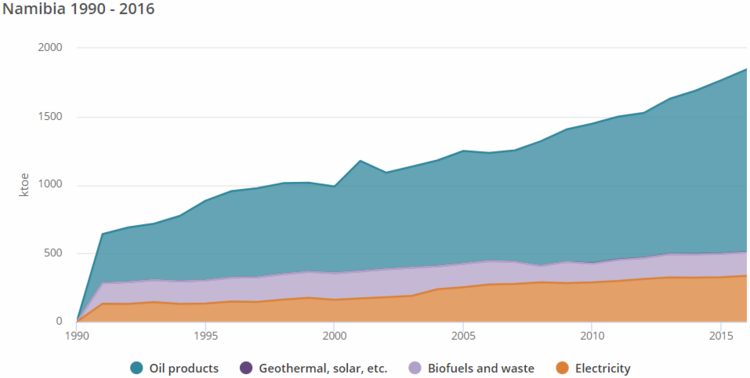
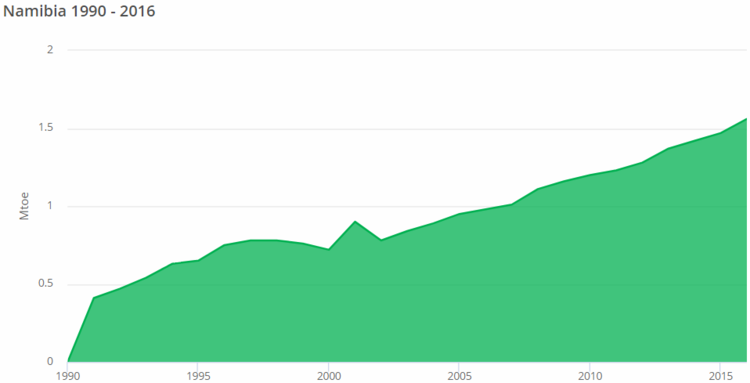
Namibia's top energy sources are petroleum, hydropower, imported electricity, and imported coal[1]. The country's own internal resources supply less than one-third of its needed energy requirements[2].
Namibia has high potential for solar, wind and biomass generation[1]. Invade bush is widely spread in the country's northern parts, which allows a large scale bioenergy-based production capacity[3][1].
The country is also on the top 10 listed countries, which are in possession of uranium resources worldwide, and it solely supplies about 8.2% of the global uranium production[3].
(Move to chapter power/electricity production): Namibia's generated electricity comes mainly from:
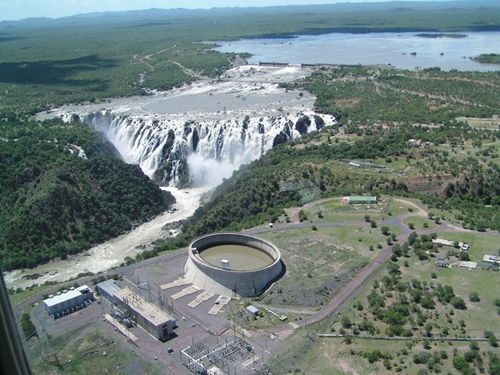
- the 240 MW hydroelectric power plant on the Kunene river in Ruacana,
- the 120 MW van Eck coal-powered plant north of Windhoek,
- the Paratus 24 MW heavy fuel-oil powered plant in Walvis Bay,
- the 5.78 MW solar plant in Trekkopje in the Erongo region. [2].
The Ruacana hydrowpower plant is a run‐of‐river station. The amount of power generated depends on the water flows from Angola. In case of insufficient flows, power generation is low.
The installed electrical generation capacity is insufficient to meet the demand for electricity. Therefore, Namibia is importing large amounts of electricity from neighboring countries mainly South-Africa. The crossborder transmission lines have a capacity of 600 MW. Another transmission line is presently built, extending the transmission system to Zambia and Zimbabwe and will have another additional capacity of 600 MW.
Energy Access
There are around 1 million Namibians lack access to electricity, which means that almost half of the country is without access at all (~53% has access & ~47% has no access)[4][5].
According to the REN21-SADC Renewable Energy and Energy Efficiency Status Report (2018), the challenge in Namibia is to provide electricity access to the 79% of the rural and sparse population that does not have access by establishing feasible and maintainable off-grid solutions. The Rural Electricity Distribution Masterplan 2010 prioritises 2,879 rural localities to be electrified in the next 20 years and identifies 27 localities for off-grid electrification (including via renewables); however, implementation has been limited.[6]
So far the country has developed several pilot mini-grids, including three off-grid systems: Gobabeb, Tsumkwe Mini Grid and Gam Solar PV Mini Grid. In rural and remote areas where neither the main grid nor mini- grids are available, consumers depend on stand-alone electricity sources, mainly diesel generators. The use of solar technologies has been increasing, and hybrid solar/diesel systems have proved to be technically sound off-grid solutions.[7]
Production
| Source | Unit | 2000 | 2005 | 2013 | 2014 | 2015 | 2016 | 2017 | 2018 |
|---|---|---|---|---|---|---|---|---|---|
| Charcoal | Kt | 72 | 102 | 135 | 145 | 161 | 161 | 161 | 163 |
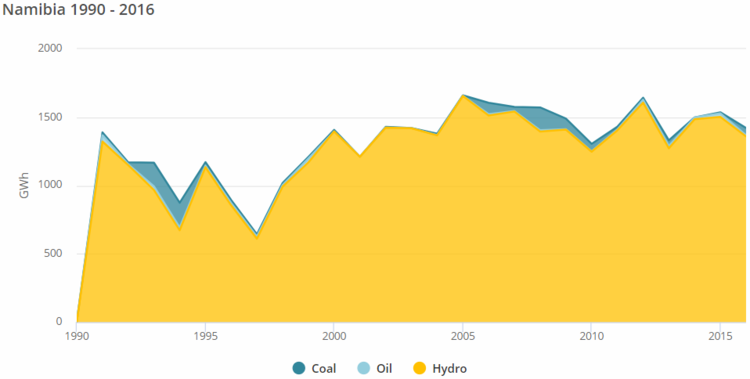
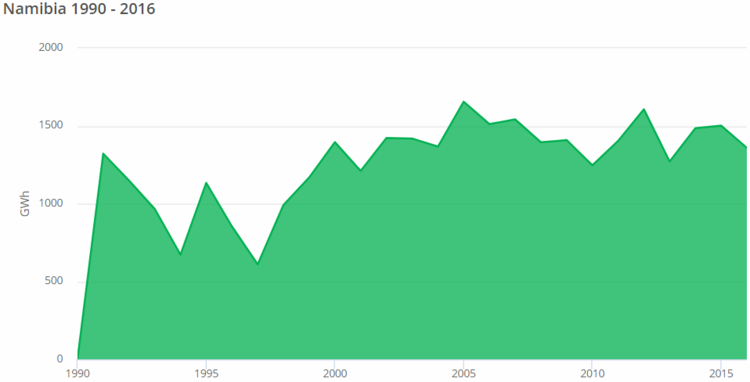
| Hydroelectricity | GWh | 1380 | 1658 | 1227 | 1485 | 1502 | 1396 | 1416 | 1436 |
| Electricity | GWh | 1414 | 1709 | 1300 | 1517 | 1555 | 1505 | 1530 | 1557 |
Installed Capacity
Consumption
Namibia's average consumption rate surpasses 3000 GWh/year, while its generation capacity is around 1305 GWh/year[1]. Therefore, there is a supply gap, which is covered by importing power from South-Africa, Zambia, and Mozambique[1].
| Source | Unit | 2000 | 2005 | 2013 | 2014 | 2015 | 2016 | 2017 | 2018 |
|---|---|---|---|---|---|---|---|---|---|
| Coal | Kt | 0 | 0 | 26 | 161 | 179 | 181 | 184 | 186 |
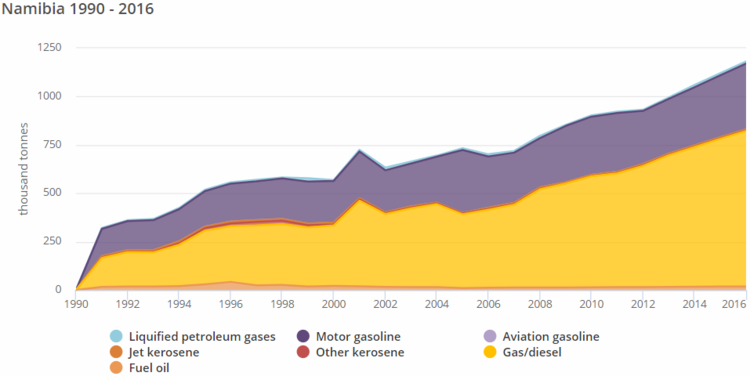
| Oil | Kt | 400 | 460 | 815 | 913 | 1195 | 1770 | 1868 | 1994 |
| Natural Gas | TJ | 0 | 722 | 2925 | 3866 | 6390 | 6099 | 6233 | 6383 |
| Electricity | GWh | 2078 | 9079 | 10536 | 11724 | 11358 | 11384 | 12244 | 13203 |
Most of the final consumed energy goes to the country's transport sector[1].
Import and Export
| Year | 2000 | 2005 | 2013 | 2014 | 2015 | 2016 | 2017 | 2018 |
|---|---|---|---|---|---|---|---|---|
| Imported Oil Capacity (Kt) | 534 | 501 | 1337 | 1024 | 1171 | 1941 | 2098 | 2283 |
Electricity
| Production | Consumption | Exports | Imports | Installed Generation | |
|---|---|---|---|---|---|
| Capacity | 1.403 billion kWh | 3.891 billion kWh | 88 million kWh | 3.073 billion kWh | 535,500 kW |
| World Ranking | 145 | 128 | 83 | 50 | 146 |
28% of Namibia's generated electricity come from fossil fuels, while 64% are from hydropower, and about 8% come from renewables[4].
Energy Security
Renewable Energy
Non-electricity off-grid renewable energy projects include the small/ micro wind energy installations used for water pumping, which are very common in Namibia, especially on farms. This technology has been used successfully for decades, with about 30,000 wind- driven water pumps installed in the country as of 2005; however, the current trend is to replace these with solar energy sources.[9]
General Indicators
| Year | 2009 | 2010 | 2011 | 2012 | 2013 | 2014 | 2015 | 2016 | 2017 | 2018 |
|---|---|---|---|---|---|---|---|---|---|---|
| Capacity | 244 | 245 | 248 | 342 | 345 | 347 | 357 | 384 | 394 | 431 |
Solar
The solar conditions in the Namibian region are to be considered of the best worldwide for solar generation[1][2]. The country's average high direct solar insolation is 2200 kWh/m2/year, with a cover of minimum clouds[1][2]. The southern region of Namibia experiences -on average- 11 hours of sunshine/day, and an average direct solar radiation of 3000 kWh/m2/year[1]. With these conditions, Namibia has a huge potential for installing solar water heaters, solar photovoltaic (PV) systems, and concentrated solar power (CSP) plants[1].
Namibia's most common PV technology application is solar PV-based pumping, which is mainly used in cattle farms[1]. Secondary solar applications in the country would be rural electrification, powering radios, lighting, TVs, and fans[3].
| Year | 2009 | 2010 | 2011 | 2012 | 2013 | 2014 | 2015 | 2016 | 2017 | 2018 |
|---|---|---|---|---|---|---|---|---|---|---|
| Capacity | 4 | 4 | 7 | 11 | 15 | 16 | 27 | 36 | 46 | 79 |
The Solar Revolving Fund under the Ministry of Mines and Energy continues to subsidise stand-alone solar systems for individual household use: between 2015 and 2017, it financed some 1,600 solar systems (water heaters, pumps and solar home systems).
Hydropower
Hydropower is the country's major source for electricity generation, particularly, the Ruacana hydroelectric power station (330 MW)[3].
| Year | 2009 | 2010 | 2011 | 2012 | 2013 | 2014 | 2015 | 2016 | 2017 | 2018 |
|---|---|---|---|---|---|---|---|---|---|---|
| Capacity | 240 | 240 | 240 | 330 | 330 | 330 | 330 | 347 | 347 | 347 |
Bioenergy
EEP Africa supported a very successful biomass energy project that is harvesting invader bush – which covers substantial areas of northern Namibia – for use in a steam boiler. The project, Combating Bush Encroachment for Namibia’s Development, has installed a 250 kW bush-to electricity gasification pilot power plant on a commercial farm in the heavily bush-infested Otavi area. The plant, which was not yet operational as of mid-2018, is considered as a proof-of-concept project to determine the financial feasibility of this approach, assess the robustness of the technology and establish Namibia’s first IPP.
Fossil Fuels
Oil
Liquid fuels in general, and oil in particular are widely used in Namibia's both household and industrial sectors[11]. Diesel and petroleum are the most used liquid fuels in the country, especially in the transport sector (~63% of Namibia's total consumed energy)[11].
Coal
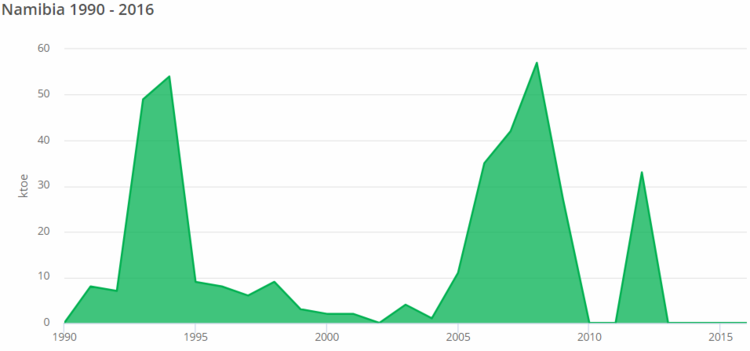
Namibia uses coal solely for generating electricity, thus through the country's only coal-powered station (Van Eck Power Station)[11]. All the coal used in Namibia is imported, and it mostly comes from South-Africa[11].
Key Problems of the Energy Sector
For Namibia to develop its energy sector and achieve energy security for the decades to come, some challenges need to be mitigated and handled properly at the first place, from which some are listed below[12][2]:
- The needed technology and engineering skills in the country are limited and underdeveloped.
- The foreign investment in the country's energy sector is very limited.
- The country lacks both incentives and national targets for developing and improving its energy sector.
- No national investments have been carried out during the past 3-4 decades, neither for developing the energy sector, nor for improving and increasing the country's electricity generation capacity.
- The local electricity tariffs, when compared to other nations in the region, are considered to be on the low level.
- The high cost of energy supply.
- The continuous droughts, which decrease the water dispatch in the Ruacana Station (Namibia's main energy supplier), consequently, the energy sector is more often incapable of meeting electric demand.
Policy Framework, Laws and Regulations
Institutional Set up in the Energy Sector
Other Key Actors / Activities of Donors, Implementing Agencies, Civil Society Organisations
Further Information
- REN21, 2018. SADC Renewable Energy and Energy Efficiency Status Report (Paris: REN21 Secretariat) http://www.ren21.net/wp-content/uploads/2018/12/SADC_2018_EN_web.pdf
- Energy Demand and Forecasting in Namibia: Energy for Economic Development (2013)
- Renewable Energy for Rural Development: A Namibian Experience (2012)
- Namibian National Issues Report on the Key Sector of Energy with a Focus on Mitigation (2010)
- Namibia's Energy Future: A Case for Renewables (2012)
- Electricity Supply Industry: National Policy of Independent Power Producers (IPPs) in Namibia (2017)
- Namibia's Energy Support Problem: The Epupa Scheme (1997)
- Energy in Namibia - VO CONSULTING.pdf Green Energy in Namibia (2009)
- SECTOR NATIONAL INTEGRATED RESOURCE PLAN (NIRP) 2016 FINAL REPORT.pdf Namibia Electricity Supply Industry: National Integrated Resource Plan Review and Update (2016)
- Africa-EU Renewable Energy Cooperation Programme (RECP): Higher Education for Renewable Energy - Country Mapping of Namibia (2015)
- Renewable Energy Policy for the Republic of Namibia.pdf National Renewable Energy Policy for the Republic of Namibia (2016)
- An Empirical Analysis of Energy Demand in Namibia (2005)
- Renewable Energy Transition for a Sustainable Future in Namibia - Master's Thesis (2012)
- Development of Namibian Energy Sector (2013)
- Energy Policy - July 2017.pdf Namibia's National Energy Policy (2017)
- Fact Sheet on Renewable Energy: Shifting Energy Systems in Namibia towards a more Sustainable Path (2015)
- Renewable Energy Market in Namibia (2012)
- Renewable Energy and Energy Efficiency Partnership (REEEP): Namibia Profile (2014)
- Namibia: Rapid Assessment and Gap Analysis
- Namibia: Nine Renewable Energy Projects Connected to Grid (2018)
- Gender and Biomass Energy Conversion in Namibia: A Case Study with Special Reference to GTZ/ProBEC Interventions (2001)
- Solar Thermal Technology Roadmap for Namibia: A Vision of Namibia's Solar Thermal Energy Future
- Supportive Framework Conditions for Mini-Grids Employing Renewable and Hybrid Generation in the SADC Region: Namibia Case Study, Gap Analysis and National Action Plan (2014)
- Harvesting of Encroacher Bush: Compendium of Harvesting Technologies for Encroacher Bush in Namibia (2015)
- Groundwater in Namibia: An Example to the Hydrological Map (2011)
- Policies and Institutions for Assuring Pro-Poor Rural Development and Food Security through Bioenergy Production: Case Studies on Bush-to-Energy and Jatropha in Namibia (2016)
- Bush-to-Electricity in Namibi (2017)
- Solid Biomass Energy in Namibia (2017)
- Namibia Announces $338 Million, 5-Year Renewable-Energy Strategy
References
- ↑ 1.00 1.01 1.02 1.03 1.04 1.05 1.06 1.07 1.08 1.09 1.10 Munyayi, R. Chiguvare, Z. & Ileka, H. (2015). Fact Sheet on: Renewable Energy – Shifting Energy Systems in Namibia towards a More Sustainable Path. Retrieved from: https://www.thinknamibia.org.na/files/learn-and-engage/jtBTlZQO-YnHdSkT.pdf Cite error: Invalid
<ref>tag; name "Munyayi, R. Chiguvare, Z. & Ileka, H. (2015). Fact Sheet on: Renewable Energy – Shifting Energy Systems in Namibia towards a More Sustainable Path. Retrieved from: https://www.thinknamibia.org.na/files/learn-and-engage/jtBTlZQO-YnHdSkT.pdf" defined multiple times with different content Cite error: Invalid<ref>tag; name "Munyayi, R. Chiguvare, Z. & Ileka, H. (2015). Fact Sheet on: Renewable Energy – Shifting Energy Systems in Namibia towards a More Sustainable Path. Retrieved from: https://www.thinknamibia.org.na/files/learn-and-engage/jtBTlZQO-YnHdSkT.pdf" defined multiple times with different content Cite error: Invalid<ref>tag; name "Munyayi, R. Chiguvare, Z. & Ileka, H. (2015). Fact Sheet on: Renewable Energy – Shifting Energy Systems in Namibia towards a More Sustainable Path. Retrieved from: https://www.thinknamibia.org.na/files/learn-and-engage/jtBTlZQO-YnHdSkT.pdf" defined multiple times with different content Cite error: Invalid<ref>tag; name "Munyayi, R. Chiguvare, Z. & Ileka, H. (2015). Fact Sheet on: Renewable Energy – Shifting Energy Systems in Namibia towards a More Sustainable Path. Retrieved from: https://www.thinknamibia.org.na/files/learn-and-engage/jtBTlZQO-YnHdSkT.pdf" defined multiple times with different content Cite error: Invalid<ref>tag; name "Munyayi, R. Chiguvare, Z. & Ileka, H. (2015). Fact Sheet on: Renewable Energy – Shifting Energy Systems in Namibia towards a More Sustainable Path. Retrieved from: https://www.thinknamibia.org.na/files/learn-and-engage/jtBTlZQO-YnHdSkT.pdf" defined multiple times with different content Cite error: Invalid<ref>tag; name "Munyayi, R. Chiguvare, Z. & Ileka, H. (2015). Fact Sheet on: Renewable Energy – Shifting Energy Systems in Namibia towards a More Sustainable Path. Retrieved from: https://www.thinknamibia.org.na/files/learn-and-engage/jtBTlZQO-YnHdSkT.pdf" defined multiple times with different content Cite error: Invalid<ref>tag; name "Munyayi, R. Chiguvare, Z. & Ileka, H. (2015). Fact Sheet on: Renewable Energy – Shifting Energy Systems in Namibia towards a More Sustainable Path. Retrieved from: https://www.thinknamibia.org.na/files/learn-and-engage/jtBTlZQO-YnHdSkT.pdf" defined multiple times with different content - ↑ 2.0 2.1 2.2 2.3 2.4 Von Oertzen, D. (2010). Namibian National Issues Report on the Key Sector of Energy with a Focus on Mitigation. Retrieved from: https://www.undpcc.org/docs/National%20issues%20papers/Energy%20(mitigation)/15_Namibia%20NIP_energy%20mitigation.pdf
- ↑ 3.0 3.1 3.2 3.3 Lund, H.G. & Mabirizi, F. (2017). Atlas of Africa Energy Resources. Retrieved from: https://www.icafrica.org/fileadmin/documents/Publications/Africa_Energy_Atlas.pdf
- ↑ 4.0 4.1 4.2 Central Intelligence Agency (CIA). (2019). The World Fact-book: Africa: Namibia. Retrieved from: https://www.cia.gov/library/Publications/the-world-factbook/geos/wa.html
- ↑ Tracking SDG7. (2019). Namibia. Retrieved from: https://trackingsdg7.esmap.org/country/namibia
- ↑ Ministry of Mines and Energy of the Government of Namibia, Implementation of the Off-Grid Energisation Master Plan (OGEMP) http://www.mme.gov.na/files/publications/541_off-grid-masterplan.pdf
- ↑ European Union Energy Initiative Partnership Dialogue Facility (EUEI PDF) and Regional Electricity Regulators Association of Southern Africa (RERA), Supportive Framework Conditions for Mini-grids Employing Renewable Energy and Hybrid Generation in the SADC Region. Namibia Case Study: Gap Analysis and National Action Plan (Eschborn, Germany: December 2013), http://www.euei-pdf.org/sites/default/files/field_publication_file/SADC_RERA_Case_Studies.zip .
- ↑ 8.0 8.1 8.2 African Energy Commission (AFREC). (2019). Africa Energy Database. Retrieved from: https://afrec-energy.org/Docs/En/PDF/2018/statistics_2018_afrec.pdf
- ↑ Danish Ener gy Management & Esbensen, Renewable Energy Market Landscape Study Covering 15 Countries in Southern and East Africa. Volume II. Country Profiles, Stakeholder Maps (August 2017), p 32 https://www.entwicklung.at/fileadmin/user_upload/Dokumente/ Regionen/Volume_II_Market_Landscape_-Study_-EEP-SEA_Country - Profiles_StakeholderMaps-1.pdf
- ↑ 10.0 10.1 10.2 Whiteman, A. Esparrago, J. Rueda, S. Elsayed, S. & Arkhipove, I. (2019). Renewable Energy Statistics 2019. Retrieved from: https://www.irena.org/-/media/Files/IRENA/Agency/Publication/2019/Mar/IRENA_RE_Capacity_Statistics_2019.pdf
- ↑ 11.0 11.1 11.2 11.3 Republic of Namibia (RoN). (2013). Energy Demand and Forecasting in Namibia – Energy for Economic Development. Retrieved from: http://www.npc.gov.na/?wpfb_dl=229
- ↑ DNV-GL. (2018). Technical Market Review – Country Profile: Namibia. Retrieved from: https://www.ctc-n.org/system/files/dossier/3b/country_profile_-_namibia.pdf


