South Africa Energy Situation


Capital:
Pretoria
Region:
Coordinates:
30.0000° S, 25.0000° E
Total Area (km²): It includes a country's total area, including areas under inland bodies of water and some coastal waterways.
1,219,090
Population: It is based on the de facto definition of population, which counts all residents regardless of legal status or citizenship--except for refugees not permanently settled in the country of asylum, who are generally considered part of the population of their country of origin.
59,893,885 (2022)
Rural Population (% of total population): It refers to people living in rural areas as defined by national statistical offices. It is calculated as the difference between total population and urban population.
32 (2022)
GDP (current US$): It is the sum of gross value added by all resident producers in the economy plus any product taxes and minus any subsidies not included in the value of the products. It is calculated without making deductions for depreciation of fabricated assets or for depletion and degradation of natural resources.
405,270,850,099 (2022)
GDP Per Capita (current US$): It is gross domestic product divided by midyear population
6,766.48 (2022)
Access to Electricity (% of population): It is the percentage of population with access to electricity.
89.30 (2021)
Energy Imports Net (% of energy use): It is estimated as energy use less production, both measured in oil equivalents. A negative value indicates that the country is a net exporter. Energy use refers to use of primary energy before transformation to other end-use fuels, which is equal to indigenous production plus imports and stock changes, minus exports and fuels supplied to ships and aircraft engaged in international transport.
-14.48 (2014)
Fossil Fuel Energy Consumption (% of total): It comprises coal, oil, petroleum, and natural gas products.
86.79 (2014)
Introduction
South Africa has significant potential to save money through energy efficiency and to increase the share of renewable energy in its energy mix. The country generates 93 percent of its electricity from coal, as a result of which it is one of the 15 largest emitters of CO2 worldwide. At the same time, increasing economic growth and a lack of investment in power plants are causing shortages in the electricity supply. After the energy crisis in 2008 the South African Government started to introduce renewable energies on a large scale and further enhanced the promotion of energy efficiency in all sectors to meet the demand of energy while reducing CO2 emissions and creating jobs. As a consequence, significant investment in renewable and energy efficiency is needed.
Increasing the diversity of South Africa’s electricity generation mix is important – not only for enhancing the crucially important security of supply of the country – but also to support job creation and mitigate climate change. The country is in the most fortunate position to have excellent solar and wind resources available. Investments in renewable technologies such as photovoltaic systems, concentrated solar power plants and wind turbines have increased significantly since 2012. However, there is still a long way to go towards meeting the country’s renewable energy targets. This holds true for the large-scale renewable power plants, but also for the significant potential of solar roof-top photovoltaic and biogas technology which currently is largely untapped.
In the years to come South Africa needs to build about 40,000 megawatt of new generation capacity to meet demand requirements. According to the National Development Plan 17,800 megawatt should be provided by renewable energies. To achieve this, the government plans to install 8,400 megawatt of wind energy, 8,400 megawatt of solar photovoltaic energy and 1,000 megawatt of concentrated solar power by 2030.
Recognised as best practice in the world, South Africa’s Renewable Energy Independent Power Producer Procurement Programme (REIPPPP), initially aimed to provide more than 7,800 megawatt of capacity from Independent Power Producers (IPPs) by 2016. Thanks to REIPPPP, South Africa’s renewable energy sector experienced an explosive growth in the past few years with investments of more than 10 billion USD so far. The REIPPPP also committed to contribute to social economic development.
Nevertheless there are still several barriers for a growing renewable energy market in South Africa – for example the integration of renewable energies into the transmission grid, the local government acceptance towards embedded generation of solar roof-top photovoltaic installations and a significant need for technical skills.
- Coal supplies 65.7% of the primary energy*
- Followed by crude oil with 21.6%
- Renewable and wastes with 7.6 %
- Gas with 2.8%
- Nuclear 0.4%
- Hydro 0.1%[1]
- Primary Energy: an energy form found in nature that has not been subjected to any conversion or transformation process to become electrical energy, refined fuels, or synthetic fuels such as hydrogen fuel

Economy General
- 1 Euro ~ 14 south African Rand (ZAR) (January 2014).
- GDP ~ 3080 Billion ZAR ~ 280 Billion Euro.
- Exports amounted to 24% of GDP in 2010.
- Large and active stock exchange that ranks 17th in the world.[2]
- Active member of BRICS
- BRICS is an international political organisation of leading emerging economies with a developing middle income status and it comprises of Brazil, Russia, India, China and South Africa.
Hydropower
In South Africa there are 1086 large dams in operation: 846 embankments and 240 concrete dams. The total water storage of all dams is about 31,6 km3, which is about 65% of the mean annual runoff of South African rivers.
Large hydro
In 2012 electricity production from hydropower was 3147 GWh (1,4%) and in an average year it is 3000 GWh. The economically feasible capacity is 4700 GWh/year. Of the technically feasible potential about 90% has been developed so far (including pumped-storage). Almost all feasible large-scale hydro potential has now been tapped.[3]
Pumped-storage
There is also 1400 MW of pumped-storage capacity in operation, with 1332 MW under construction (Ingula) and completion scheduled for 2014/2015.
Small Hydro Power
At present 61 MW os SHP is in operation in four plants, producing 350 GWh/year. Further 50 MW could be developed at small schemes in the future.
Two new small hydropower development will be constructed under the Renewable Energy Independent Procurement Power Producer Program: The Stortemelk in Dihabeng (Free State) with 4,3 MW will be constructed in an existing dam and the Neusberg in Kakamas (Northern Cape) with 10 MW.
The Eastern Cape and KwaZulu-Natal are endowed with the best potential for the development of small, i.e. less than 10MW hydropower plants. The advantages and attractiveness of these plants are that they can either be standalone or in a hybrid combination with other renewable energy sources. Advantage can be derived from the association with other uses of water (water supply, irrigation, flood control, etc.), which are critical to the future economic and socio-economic development of South Africa.
Hydropower from neighbouring countries
The Southern African Power Pool (SAPP) allows and supports the free trading of electricity between Southern African Development Community (SADC) member countries, providing South Africa with access to the vast hydropower potential in the countries to the north, notably the significant potential in the Zambezi River.
Solar Energy
Most areas in South Africa average more than 2 500 hours of sunshine per year, and average solar-radiation levels range between 4.5 and 6.5kWh/m2 in one day.
The southern African region, and in fact the whole of Africa, has sunshine all year round. The annual 24-hour global solar radiation average is about 220 W/m2 for South Africa, compared with about 150 W/m2 for parts of the USA, and about 100 W/m2 for Europe and the United Kingdom. This makes South Africa's local resource one of the highest in the world. [4]
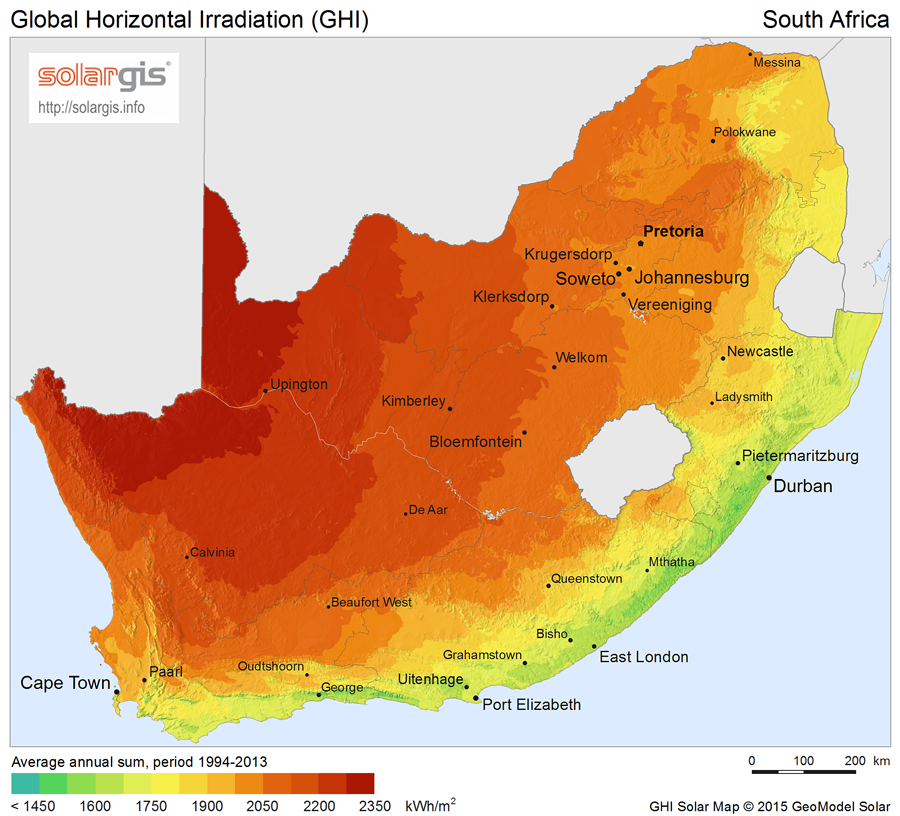
The South-west region has the most potential for solar in South Africa as can be seen from the above graph.
Market Entry Barrier
There are no particular barriers for entering the market but following Steps need to be followed for setting up a Solar Power Plant/Project:
- Application-Department of Energy(DOE) invite Potential developers to submit their application/ proposals
- Allotment -DOE with then assign a particular developer for the project after considering thier prices, proposals etc. It is a confidential process within DOE.
- PPA-The successful bidders / developer then signs Power Purchase agreement (PPA) with Eskom (South africa biggest utility).
- Land Acquisition
- EPC- The sucessful bidder/project owner/ developer then hire an Engineering, Procurement and Constrcution (EPC) company for sucessful implementation of the project.
- Commissioning- EPC handover the project to the owner after commisoning of the project and connecting it to the Grid .
Concentrated Solar Power (CSP)
Foursuccessful bids from the REI4P were allocated 300 MW:
- Khi Solar One - Tower,50 MW
Parabolic Trough, 100 MW
Bokpoort, Parabolic trough, 50MW
Xina Solar One, Parabolic Trough, 100 MW
+ Kiwano Eskom CSP plant with 100 MW CSP plant, near Upington. This project is being co-financed with the African Development Bank, Agence Française de Développement, Clean Technology Fund (CTF), KfW and the World Bank.
The successful bidders were Abengoa (100 MW trough with three hours storage and 50 MW tower with two hours of thermal storage) in the first round and ACWA Power Solafrica Bokpoort CSP (50 MW with nine and a half hours thermal storage) in the second round. For the three CSP allocations, the key Engineering, Procurement and Construction (EPC)Teyma, and for SolAfrica they are TSK Electrónica y Electricidad, Acciona, Sener and Crowie. Other CSP solar technology providers developing projects in South Africa includeproprietary technology.
The Department of Energy (DoE) introduced during the III window bidding process of the REI4P an incentive in the form of a Time of Day (TOD) tariff to further encourage CSP with storage to generate energy during peak time.
A base tariff applies during the day and a higher tariff will be applied for supplying energy during peak time. According to the initial proposal, a bidder supplying energy during the peak time between 17h00 and 21h00 would get 240% of the base tariff, while there is no payment for supplying energy at night. After the amendment the peak period was extended from 16h30 to 21h30 and the tariff increased to 270% of the base tariff. This TOD tariff recognizes the intrinsic value of storage for shifting generation in order to meet demand. The new TOD tariff does not make financial sense for a CSP project without storage, and will force all future CSP plants to have storage. Furthermore the increasing need for dispatchable RE capacity has also been addresses by the recently updated IRP, which foresees in 2030 a total installed CSP capacity of 3.000 MW in its Base Case Scenario and 4.700 MW in its Moderate Decline Scenario.
The Southern Africa Solar Thermal Electricity Association (SASTELA) is an industry led body that is at the forefront of promoting the deployment of stations, the localisation and industrialisation of CSP components. SASTELA’s vision is to ensure that solar thermal electricity generated by CSP power stations become part of the energy mix and plays an essential role in Southern Africa’s transition to a low carbon regional economy.[5]
Biomass
South Africa has tremendous biofuel potential when considering the capacity to grow total plant biomass (all lignocellulosic plant biomass. According to conservative estimates, South Africa produces about 18 million tonnes of agricultural and forestry residues every year. The South African biofuels target for 2008‐2013, according to Industrial Biofuels Strategy (2007), has been fixed at 2% penetration level in the national liquid fuel supply, which corresponds to 400 million litres per annum. When considering the use of 50‐70% of this plant biomass with second generation biochemical and thermochemical technologies, South Africa has the potential to substitute the bulk of its current liquid fossil fuel usage (currently 21.2 BL/annum) with renewable biofuels. However, the only real activity has been US$437 million investment by the South Africa’s Industrial Development Corporation (IDC) and Energy Development Corporation (EDC) in two biofuels projects that will collectively produce 190 million litres of bioethanol from sugarcane and sugarbeet.[6]
Biogas
Waste in South Africa
The third national waste baseline shows the amount of waste generated in South Africa in 2011.
|
Waste cathegory[7] |
In milion tonnes |
In % |
Recycled |
|
Total waste generated |
108 |
|
|
|
Disposed of at landfill |
98 |
|
|
|
Hazardous waste’ |
|
1 |
|
|
Unclassified waste: The Minimum Requirements for the Handling, Classification and Disposal of Hazardous Waste (DWAF, 1998) refers to relatively low hazard wastes which are generated in high Volumes (Fly ash and dust, Bottom ash, Slag, Brine, Mineral waste, Sewage sludge, etc.) |
48 |
44 |
|
|
General waste: means waste that does not pose an immediate hazard or threat to health or the environment, and includes: domestic waste, building and demolition waste; business waste; and inert waste. |
59 |
55 |
10 |
|
Other (mostly biomass waste from industry) |
36 |
61 |
0 |
|
Non recyclable general municipal waste |
8 |
35 |
0 |
|
Recyclable waste at (this category includes plastic, paper, glass, metal and tyres). |
7,4 |
10 |
|
|
Construction and demolition waste |
4.7 |
20 |
16 |
|
Organic waste |
3 |
13 |
35 |
|
food waste generated by
|
9
|
|
|
Waste in the commercial and industrial waste category has been excluded from the total amount of general waste generated to avoid double counting in the baseline report (DEA, 2012). Waste management still largely relies on landfills at 80-90% of waste. In South Africa, landfill remains the cheapest waste disposal option, although the costs are increasing.
The National Waste Management Strategy has set ambitious targets to establish 2600 small and medium enterprises (SMEs) and 69000 new jobs from the waste sector by 2016. There are significant opportunities to increase recovery of waste, and divert waste from landfills. This would require innovation funding models for such projects, and present an opportunity to increase the contribution of the informal sectors and the private sectors.[8]
Biogas
Because of the changing regulatory framework, there is increasing use of biogas across South Africa and a number of digesters are either completed or planned. This is linked to government incentives for renewable energy production and increasing costs of waste management as well as stricter regulations.
REI4P
REIPPPP replaced the Renewable Energy Feed in Tariff programme where prospective producers of sites with capacity over 5 MW must bid and the producer with the lowest feed in tariff wins. The bidding is done bi-annually. This provides a potential source of financial and operational support for biogas and landfill. A separate programme called The Small Projects IPP Procurement Programme had being developed for projects under 5 MW. The DoE issued Request for Information documents for small-scale renewable energy projects (15 June 2012).[9]
Industry associations
The Southern African Biogas Industry Association (SABIA) is a public, non-profit organization established for the sole object of promoting the sustainable growth of the biogas industry in Southern Africa with a potential to generate 2500 MW of power. The association was launched during Q1 of 2013 and is in the process of establishing itself. Currently, SABIA has 12 corporate members. In October 2013 SABIA organised the first Biogas National Conference.[10]
Wind Energy
South Africa has an excellent wind resource which is dispersed geographically. The cost of wind power is already competitive with New coal and shall reach grid parity by 2016/2017 Wind Atlas for South Africa.
The Integrated Resource Plan (IRP) 2010-2013 (revised November 2013) made important adjustments which will influence energy planning and implementation in South Africa. The latest IRP include a downwardly-revised electricity and peak demand and also recommends the continuation of the current renewable energy bidding programme with additional annual rounds of 1000 MW PV capacity; 1000 MW wind capacity and 200 MW CSP capacity. The revised IRP generated vigorous debate, also in the wind industry in South Africa which argued that the allocation to wind power should be increased, seeing that wind is now 30% cheaper per kilowatt-hour than electricity generated from Medupi[11]. An estimated minimum allocation of 500 MW per year is required to stimulate the development of a sustainable wind energy industry, which will enable job creation and sectoral growth.
South Africa’s Renewable Energy Programme Implementation programme
South Africa’s renewable energy sector experienced explosive growth in the past few years with investment of more than $5.5 billion in 2012, up from a meagre $30 million in 2011- representing an impressive increase of 20,500%. South Africa’s leading position has been secured through a supportive policy environment, coupled with a secure investment framework established by National Treasury and the Department of Energy’s (DoE) Renewable Energy Independent Power Producer Procurement Programme or REI4P.
The Department of Energy launched the REI4P in 2011 and aims to award power purchase agreements for projects with an overall capacity of 3725 MW to be installed by the end of 2016. Provision has been made for five consecutive bidding windows. Preferred bidders under windows 1 and 2 have reached financial close while preferred bidders under window three have been announced. In total, 62 wind projects have been allocated under the first three windows. The total allocation to wind energy for the REI4P programme amounts to 3 320 MW of which 1 984 MW was allocated under the first three bidding windows. In line with the revised IRP, an additional annual allocation of 1000 MW to wind will be made from 2014 onwards.
The price of wind energy has also steadily decreased[12]:
|
Wind Energy |
Bid Window 1 |
Bid Window 2 |
Bid Window 3 | ||||
|
Price fully indexed (Av. R/kWh base April 2011 |
R1, 243 |
R0.897 |
R0.656 | ||||
|
Price fully indexed (Av. R/kWh base April 2013 |
R1, 284 |
R1,008 |
R0,737 | ||||
Wind projects show an average price decrease of 42%[13] and are cheaper than electricity from Medupi. Current wind energy costs 74 ZAR cents per kilowatt hour on average (van den Bergh, 2014). The current 62 wind energy projects created an estimated 19.108 FTE for construction and 34.936 for O&M (or 1.747 permanent jobs for 20 years).
Wind energy projects also showed steady increases in local content across the three bidding windows[12]:
|
Wind Energy |
Bid Window 1 |
Bid Window 2 |
Bid Window 3 | ||||
|
Local content value |
R2391 –m |
R1638-m |
R5627-m | ||||
|
Local content |
21.7% |
36.7% |
46.9% | ||||
South Africa’s wind farms:
The following provides a highlight of some of the wind farms in South Africa: Metrowind Van Stadens Wind Farm, 30km west of Port Elizabeth, was the first to be constructed. The location gets strong wind from the Indian Ocean at levels higher than anywhere in the area. The installation features nine 90m high turbines with three blades each. The first turbine was hoisted into place by the largest crane ever used in SA, and came online in August 2013, and will begin feeding 27 MW into the national grid from 2014 – at an estimation of 80 000 MW hours per year. The R475 million construction contract is held by Basil Read Matomo.
- Kouga Wind Farm, near St Francis Bay: Construction at Kouga began in 2013, and turbine delivery is scheduled for late 2013 to mid-2014. The turbines are set to be completed in September 2014, with the whole project set to be complete in November 2014. The project belongs to Red Cap, and investors include Standard Bank, Inspired Evolution and The Kouga Wind Farm Community Development Trust.
- Jeffreys Bay Wind Farm: Construction began mid-2013 on 60 wind turbines at Jeffreys Bay, and the project will provide 138 MW into the national grid once completed in mid-2014.
Other wind farms include Red Cap Gibson Bay, Longyuan Mulio De Aar 2 north wind, Nojoli, Khobab, Noupoort and Loeriesfontein.[14]
Geothermal Energy
There is, currently, no large-scale geothermal production in South Africa, since coal is abundant and relatively cheap, supplying the largest part of the country’s energy requirements. However, the Renewable Energy Policy Network for the 21st Century, or REN21, ‘Renewables 2010 Global Status Report’ states that, as the geothermal market continues to broaden, a significant acceleration in installations is expected, with advanced technologies enabling the development of geothermal power projects in new countries.[15]
Policy Framework, Laws and Regulations
- 2003--Renewable Energy White Paper (2003) targetted 10000 GWh(4%) of Renewable Energy by 2013
- January 2010--Integrated Resource Plan (IRP 1) targettted 1025 MW Private sector Renewable Energy by 2013
- October 2010--IRP 2010 targetting 7200MW(16%) Renewable Energy by 2030
- March 2011--> South Africa approved its Integrated Resource Plan (IRP) for the energy sector. The plan outlines the government's strategy for electricity generation by 2030. It sets a further ambitious target of 21,5 GW of new installed renewable energy generation capacity by 2030, comprising 9200 MW of wind capacity, 8400 MW of solar PV capacity, 1200 MW of solar CSP capacity.[16]
- The Renewable Energy Independent Power Producer Procurement Programme (REIPPPP or REI4P) is the major driver of installing green power generation capacity in South Africa. It not only focusses on delivering sustainable power to the grid but also at creating jobs and fostering local development. The National Treasury (NT) and the Department of Energy (DoE) have joined forces to establish the Independent Power Producer (IPP) Office to manage the REIPPPP. For further information please look at [here http://bit.ly/1rbijDn]
Links: Industry Associations
- Southern Africa Solar Thermal and Electricity Association (SASTELA)
- South African Wind Energy Association (SAWEA)
- Southern African Biogas Industry Association (SABIA)
- Sustainable Energy Society Southern Africa (SESSA)
- South African Photovoltaic Industry Association (SAPVIA); National Business Initiative (NBI)
- Energy Intensive User Group (EIUG)
- Independent Power Producers Association SAIPPA
- South African Association of Energy Services Companies (SAAEs)
- The Southern African Association for Energy Efficiency
Links: National Government
- South Africa Government Online
- Cooperative Governance Traditional Affairs
- Department of Environmental Affairs (DEA)
- Department of Public Works (DPW)
- Department: Trade and Industry (DTI)
- Department of Science and Technology (DST)
- Department of Energy (DOE)
- CEF; Eskom
- Economic Development Department (EDD)
- NERSA
- National Treasury (NT)
- National Planning Commission (NPC)
- South African National Energy Development Institute (SANEDI)
Links: Local Financing Institutions
- Industrial Development Corporation (IDC):idc.co
- Development Bank of Southern Africa (DBSA):dbsa.org
- The African Development Bank (AfDB):afdb.org
Links: Provincial Government
- Eastern Cape
- Western Cape
- WESGRO
- KZN Sustainable Energy Forum
- Gauteng Province Infrastructure Development
Links: Local Government
- Association of Municipal Electricity Utilities (AMEU)
- City Energy Support Unit
- South African Local Government Association (SALGA)
Links: NGOs
- Earthlife Africa
- Greenpeace
- Southern African AlternativeEnergy Association
- Electricity Governance Initiative
- treasurethekaroo
- Koeberg Alert Alliance
- WWF South Africa - Climate Change
- Sustainable Energy Africa (SEA)
- Green Building Council of South Africa (GBCSA)
- SANEA
Links: Research & University
- Energy Research Centre
- South African Renewable Energy Technology Centre (SARETEC), Cape Peninsula University of Technology
- Centre for Renewable & Sustainable Energy Studies
- CSIR
- Johannesburg University Sustainable energy Technology and Research (SeTAR) Centre
- UKZN
- Technical University of Tshwane (TUT)/ M&V Unit
- University of Witswatersrand (WITS), Johannesburg
Links: Regional
- SAPP
- Infrastructure and Energy African Union
- SADC Energy: Centre for Renewable Energy and Energy Efficiency (SACREEE)
Further Information
References
- ↑ Department of Energy, South African Energy Synopsis, 2010fckLR http://www.energy.gov.za/files/media/explained/2010/South_African_Energy_Synopsis_2010.pdffckLR
- ↑ Sources: World Bank, http://data.worldbank.org/country/south-africafckLRUS Department of State – Background note South Africa, fckLRhttp://www.state.gov/r/pa/ei/bgn/2898.htmfckLR
- ↑ Hydropower & Dams World Atlas, 2013 (page 108)
- ↑ http://www.energy.gov.za/files/esources/renewables/r_solar.html
- ↑ www.sastela.org.za
- ↑ http://cleantechsolutions.wordpress.com/2011/12/27/biomass-energy-in-south-africa/
- ↑ http://sawic.environment.gov.za/documents/1880.pdf
- ↑ http://green-cape.co.za/assets/Uploads/GreenCape-MIR-Waste.pdf
- ↑ http://southafrica.nlembassy.org/binaries/content/assets/postenweb/z/zuid_afrika/netherlands-embassy-in-pretoria/import/the_embassy/economic-affairs/waste-to-energy-intro.pdf
- ↑ http://biogasassociation.co.za/
- ↑ van den Berg, J. 2014. Wind power costs drop further below coal. 25o Degrees. Volume 8 number 6. December/January 2014
- ↑ 12.0 12.1 Rycroft (2013)
- ↑ Rycroft, M. 2013. Summary of REIPPPP round three projects. Energize. December 2013 page 7-9
- ↑ http://www.windlab.com/node/360
- ↑ http://www.engineeringnews.co.za/article/south-africas-geothermal-prospects-2010-10-15
- ↑ Department of Energy (DOE), South Africa


