Difference between revisions of "Tajikistan Energy Situation"
***** (***** | *****) |
***** (***** | *****) |
||
| Line 110: | Line 110: | ||
<br> | <br> | ||
| − | === Forest | + | === Forest Situation === |
| + | |||
| + | Land area covered by forest: 2.9%<br>Forest annual rate of change (2005-2010) : 0% <ref>FAO (2011): The State of the World's Forest</ref> | ||
| + | |||
| + | | ||
== Socioeconomical Situation == | == Socioeconomical Situation == | ||
=== Income Sources === | === Income Sources === | ||
| + | |||
| + | Agriculture: 49.8%, industry: 12.8%, services: 37.4% <ref name="CIA">CIA - The World Factbook</ref> | ||
| + | |||
| + | <br> | ||
= Energy Situation = | = Energy Situation = | ||
| Line 125: | Line 133: | ||
=== Electricity === | === Electricity === | ||
| − | |||
| − | |||
==== Sources ==== | ==== Sources ==== | ||
| − | + | About 90 % of electricity generating capacity is hydroelectric, but only an estimated 5% of its potential is in use. Tajikistan's rivers, have great hydropower potential, and the government has focused on attracting investments for projects for internal use and electricity exports. <ref>INOGATE Energy Portal</ref> | |
==== Stability ==== | ==== Stability ==== | ||
| Line 137: | Line 143: | ||
== Energy Consumption == | == Energy Consumption == | ||
| − | |||
| − | |||
=== National Level === | === National Level === | ||
| Line 172: | Line 176: | ||
=== Electrification Rate === | === Electrification Rate === | ||
| − | |||
| + | |||
| + | National: 85.4% | ||
| + | <ref>http://www.ngdc.noaa.gov/dmsp/pubs/Elvidge_WINTD_20091022.pdf</ref> | ||
== Renewable Energies == | == Renewable Energies == | ||
=== Application === | === Application === | ||
| − | + | ||
| + | |||
| + | Hydro-power is the only RE source for electricity production on national level, whose input is documented. | ||
| + | <ref>http://www.iea.org/stats/renewdata.asp?COUNTRY_CODE=KG</ref> | ||
| + | | ||
=== Potentials === | === Potentials === | ||
| Line 254: | Line 264: | ||
= References = | = References = | ||
| − | <references /><references /><references /> | + | <references /><references /><references /><references /><references /><references /><references /> |
[[Category:Tajikistan]] | [[Category:Tajikistan]] | ||
Revision as of 17:01, 31 October 2011
Overview
| Tajikistan | |||
| |
| ||
|
Capital |
| ||
|
Official language(s) |
| ||
|
Government |
| ||
|
President |
| ||
|
Prime Minister |
| ||
|
Total area |
| ||
|
Population |
| ||
|
GDP (nominal) |
| ||
|
GDP Per capita |
| ||
|
Currency |
| ||
|
Time zone |
| ||
|
Calling code |
| ||
Environmental Situation
Climate
Mean temperature (°C min/max): 8.1 / 22.0 [1]
Resources
Pamir and Alay Mountains dominate landscape; western Fergana Valley in north, Kofarnihon
and Vakhsh Valleys in southwest [1]
Forest Situation
Land area covered by forest: 2.9%
Forest annual rate of change (2005-2010) : 0% [2]
Socioeconomical Situation
Income Sources
Agriculture: 49.8%, industry: 12.8%, services: 37.4% [1]
Energy Situation
Type your text here
Energy Supply
Type your text here
Electricity
Sources
About 90 % of electricity generating capacity is hydroelectric, but only an estimated 5% of its potential is in use. Tajikistan's rivers, have great hydropower potential, and the government has focused on attracting investments for projects for internal use and electricity exports. [3]
Stability
Type your text here
Energy Consumption
National Level
Electricity
Household Level
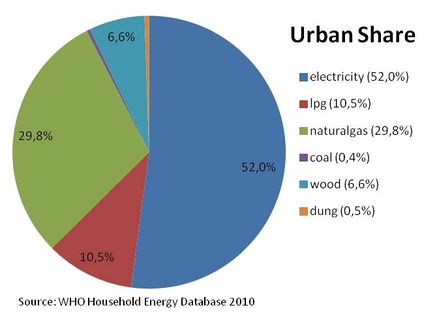
Share of energy types on cooking energy in urban areas of Tajikistan.[4]
Share of energy types on cooking energy in urban areas of Tajikistan.[4]
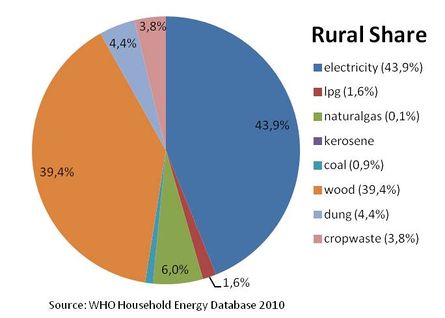
Percentage of population using solid fuels as cooking energy. Solid fuels include charcoal, coal, cropwaste, dung and wood.
National: 21.5%, urban:<5%, rural: 34.5% [4]
Solid Fuel Use Impact on Health
Total annual deaths attributable to solid fuel use: 1600 persons
Percentage of national burden of diseases attributable to solid fuel use: 3.5%[5]
Access Rate
Electrification Rate
National: 85.4% [6]
Renewable Energies
Application
Hydro-power is the only RE source for electricity production on national level, whose input is documented. [7]
Potentials
Solar Energy
Type your text here
Wind Energy
Type your text here
Biomass
Type your text here
Biogas
Type your text here
Hydro Power
Type your text here
Other renewable Sources
Type your text here
Key problems of the energy sector
Type your text here
Policy framework, laws and regulations
Type your text here
General Energy policy, Energy strategy
Type your text here
Important Laws and regulations
Type your text here
Specific strategies (Biomass, renewable energies, rural electrification, energy access strategy etc.)
Type your text here
Institutional set up in the energy sector
Type your text here
Governmental institutions Private sector (enterprises, NGOs)
Type your text here
Activities of other donors, activities of NGOs
Type your text here
Existing projects
Type your text here
Publications
Type your text here
External links
References
- ↑ 1.0 1.1 1.2 CIA - The World Factbook
- ↑ FAO (2011): The State of the World's Forest
- ↑ INOGATE Energy Portal
- ↑ 4.0 4.1 4.2 WHO 2010: WHO Household Energy Database
- ↑ WHO (2006): Fuel for Life - Household Energy and Health
- ↑ http://www.ngdc.noaa.gov/dmsp/pubs/Elvidge_WINTD_20091022.pdf
- ↑ http://www.iea.org/stats/renewdata.asp?COUNTRY_CODE=KG


