Difference between revisions of "The Economics of Renewable Energy"
***** (***** | *****) |
***** (***** | *****) |
||
| Line 74: | Line 74: | ||
<br/> | <br/> | ||
| − | [[File:Economics of RE 15- New Global Investments ($Bn) in Renewables by Asset Class 2004-2017 (FS-UNEP, 2018).PNG|thumb|center| | + | [[File:Economics of RE 15- New Global Investments ($Bn) in Renewables by Asset Class 2004-2017 (FS-UNEP, 2018).PNG|thumb|center|850px|New Global Investments ($Bn) in Renewables by Asset Class 2004-2017 (FS-UNEP, 2018)]]<br/> |
| − | [[File:Economics of RE 16- New Global Investments ($Bn) in Renewables in Developing & Developed Countries 2004-2017 (FS-UNEP, 2018).PNG|thumb|center| | + | [[File:Economics of RE 16- New Global Investments ($Bn) in Renewables in Developing & Developed Countries 2004-2017 (FS-UNEP, 2018).PNG|thumb|center|850px|New Global Investments ($Bn) in Renewables in Developing & Developed Countries 2004-2017 (FS-UNEP, 2018)]]<br/> |
| − | [[File:Economics of RE | + | <br/>[[File:Economics of RE 19- New Global Investments in Renewables by the Type of Economy 2004-2017 (FS-UNEP, 2018).PNG|thumb|center|850px|New Global Investments in Renewables by the Type of Economy 2004-2017 (FS-UNEP, 2018)]]<br/> |
| − | [[File:Economics of RE | + | [[File:Economics of RE 20- New Global Investments ($Bn) in Renewables by Region in 2017 (FS-UNEP, 2018).PNG|thumb|center|850px|New Global Investments ($Bn) in Renewables by Region in 2017 (FS-UNEP, 2018)]] |
| − | + | <br/> | |
| − | <br/> | + | [[File:Economics of RE 17- Public Markets Investment ($Bn) in RE by Sector in 2017 (FS-UNEP, 2018).PNG|thumb|center|850px|Public Markets Investment ($Bn) in RE by Sector in 2017 (FS-UNEP, 2018)]]<br/> |
<div> | <div> | ||
Renewable energy technologies (<span data-scayt_word="rets" data-scaytid="12">RETs</span>) continue to face a number of '''[[Barriers and Risks to Renewable Energy Financing|barriers]]. '''However, the major challenge is mainly economic, as the issue of renewable energy technologies' costs is vital and central for the prediction of how rapidly the current energy transition will be taking place<ref name="Timmons, D. Harris, J. M. & Roach, B. (2014). The Economics of Renewable Energy. Retrieved From: https://ase.tufts.edu/gdae/education_materials/modules/RenewableEnergyEcon.pdf">Timmons, D. Harris, J. M. & Roach, B. (2014). The Economics of Renewable Energy. Retrieved From: https://ase.tufts.edu/gdae/education_materials/modules/RenewableEnergyEcon.pdf</ref><ref name="Meier, P. Vagliasindi, M. Imran, M. Eberhard, A. & Siyambalapitiya, T. (2015). The Design and Sustainability of Renewable Energy Incentives: An Economic Analysis. Retrieved From: https://openknowledge.worldbank.org/bitstream/handle/10986/20524/922240PUB0978100Box385358B00PUBLIC0.pdf?sequence=1">Meier, P. Vagliasindi, M. Imran, M. Eberhard, A. & Siyambalapitiya, T. (2015). The Design and Sustainability of Renewable Energy Incentives: An Economic Analysis. Retrieved From: https://openknowledge.worldbank.org/bitstream/handle/10986/20524/922240PUB0978100Box385358B00PUBLIC0.pdf?sequence=1</ref>. The costs include: infrastructure investment, day-to-day operations, market costs of supply and the environmental costs of the different energy sources<ref name="Timmons, D. Harris, J. M. & Roach, B. (2014). The Economics of Renewable Energy. Retrieved From: https://ase.tufts.edu/gdae/education_materials/modules/RenewableEnergyEcon.pdf">Timmons, D. Harris, J. M. & Roach, B. (2014). The Economics of Renewable Energy. Retrieved From: https://ase.tufts.edu/gdae/education_materials/modules/RenewableEnergyEcon.pdf</ref><ref name="Meier, P. Vagliasindi, M. Imran, M. Eberhard, A. & Siyambalapitiya, T. (2015). The Design and Sustainability of Renewable Energy Incentives: An Economic Analysis. Retrieved From: https://openknowledge.worldbank.org/bitstream/handle/10986/20524/922240PUB0978100Box385358B00PUBLIC0.pdf?sequence=1">Meier, P. Vagliasindi, M. Imran, M. Eberhard, A. & Siyambalapitiya, T. (2015). The Design and Sustainability of Renewable Energy Incentives: An Economic Analysis. Retrieved From: https://openknowledge.worldbank.org/bitstream/handle/10986/20524/922240PUB0978100Box385358B00PUBLIC0.pdf?sequence=1</ref>. | Renewable energy technologies (<span data-scayt_word="rets" data-scaytid="12">RETs</span>) continue to face a number of '''[[Barriers and Risks to Renewable Energy Financing|barriers]]. '''However, the major challenge is mainly economic, as the issue of renewable energy technologies' costs is vital and central for the prediction of how rapidly the current energy transition will be taking place<ref name="Timmons, D. Harris, J. M. & Roach, B. (2014). The Economics of Renewable Energy. Retrieved From: https://ase.tufts.edu/gdae/education_materials/modules/RenewableEnergyEcon.pdf">Timmons, D. Harris, J. M. & Roach, B. (2014). The Economics of Renewable Energy. Retrieved From: https://ase.tufts.edu/gdae/education_materials/modules/RenewableEnergyEcon.pdf</ref><ref name="Meier, P. Vagliasindi, M. Imran, M. Eberhard, A. & Siyambalapitiya, T. (2015). The Design and Sustainability of Renewable Energy Incentives: An Economic Analysis. Retrieved From: https://openknowledge.worldbank.org/bitstream/handle/10986/20524/922240PUB0978100Box385358B00PUBLIC0.pdf?sequence=1">Meier, P. Vagliasindi, M. Imran, M. Eberhard, A. & Siyambalapitiya, T. (2015). The Design and Sustainability of Renewable Energy Incentives: An Economic Analysis. Retrieved From: https://openknowledge.worldbank.org/bitstream/handle/10986/20524/922240PUB0978100Box385358B00PUBLIC0.pdf?sequence=1</ref>. The costs include: infrastructure investment, day-to-day operations, market costs of supply and the environmental costs of the different energy sources<ref name="Timmons, D. Harris, J. M. & Roach, B. (2014). The Economics of Renewable Energy. Retrieved From: https://ase.tufts.edu/gdae/education_materials/modules/RenewableEnergyEcon.pdf">Timmons, D. Harris, J. M. & Roach, B. (2014). The Economics of Renewable Energy. Retrieved From: https://ase.tufts.edu/gdae/education_materials/modules/RenewableEnergyEcon.pdf</ref><ref name="Meier, P. Vagliasindi, M. Imran, M. Eberhard, A. & Siyambalapitiya, T. (2015). The Design and Sustainability of Renewable Energy Incentives: An Economic Analysis. Retrieved From: https://openknowledge.worldbank.org/bitstream/handle/10986/20524/922240PUB0978100Box385358B00PUBLIC0.pdf?sequence=1">Meier, P. Vagliasindi, M. Imran, M. Eberhard, A. & Siyambalapitiya, T. (2015). The Design and Sustainability of Renewable Energy Incentives: An Economic Analysis. Retrieved From: https://openknowledge.worldbank.org/bitstream/handle/10986/20524/922240PUB0978100Box385358B00PUBLIC0.pdf?sequence=1</ref>. | ||
| Line 96: | Line 96: | ||
= <span style="font-size: 19px; line-height: 23px">Economic Rationale for Renewables</span> = | = <span style="font-size: 19px; line-height: 23px">Economic Rationale for Renewables</span> = | ||
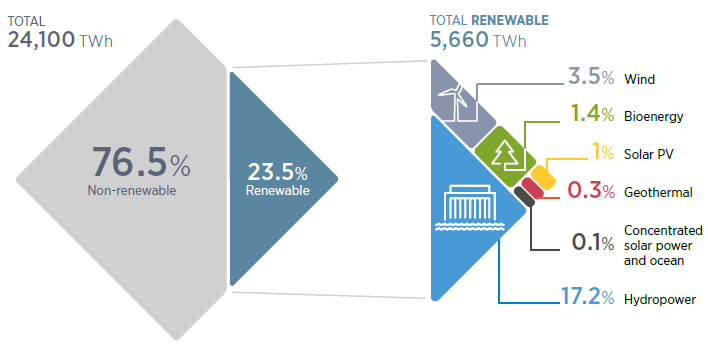
| − | While by 2014 the world was getting about 80% of its | + | While by 2014 the world was getting about 80% of its electricity supplies from fossil fuels<ref name="Timmons, D. Harris, J. M. & Roach, B. (2014). The Economics of Renewable Energy. Retrieved From: https://ase.tufts.edu/gdae/education_materials/modules/RenewableEnergyEcon.pdf">Timmons, D. Harris, J. M. & Roach, B. (2014). The Economics of Renewable Energy. Retrieved From: https://ase.tufts.edu/gdae/education_materials/modules/RenewableEnergyEcon.pdf</ref>, that percentage has gone down 3.5-4% only within 3-4 years<ref name="Meier, P. Vagliasindi, M. Imran, M. Eberhard, A. & Siyambalapitiya, T. (2015). The Design and Sustainability of Renewable Energy Incentives: An Economic Analysis. Retrieved From: https://openknowledge.worldbank.org/bitstream/handle/10986/20524/922240PUB0978100Box385358B00PUBLIC0.pdf?sequence=1">Meier, P. Vagliasindi, M. Imran, M. Eberhard, A. & Siyambalapitiya, T. (2015). The Design and Sustainability of Renewable Energy Incentives: An Economic Analysis. Retrieved From: https://openknowledge.worldbank.org/bitstream/handle/10986/20524/922240PUB0978100Box385358B00PUBLIC0.pdf?sequence=1</ref><ref name="International Renewable Energy Agency (IRENA). International Energy Agency (IEA). & Renewable Energy Policy Network for the 21st Century (REN21). (2018). Renewable Energy Policies in a Time of Transition. Retrieved From: http://www.ren21.net/wp-content/uploads/2018/04/17-8622_Policy_FullReport_web_.pdf">International Renewable Energy Agency (IRENA). International Energy Agency (IEA). & Renewable Energy Policy Network for the 21st Century (REN21). (2018). Renewable Energy Policies in a Time of Transition. Retrieved From: http://www.ren21.net/wp-content/uploads/2018/04/17-8622_Policy_FullReport_web_.pdf</ref>. In 2017/18 fossil fuels contributed approximately 76.5% to the global electricity supply, reflecting the rise in the global renewables' market<ref name="Meier, P. Vagliasindi, M. Imran, M. Eberhard, A. & Siyambalapitiya, T. (2015). The Design and Sustainability of Renewable Energy Incentives: An Economic Analysis. Retrieved From: https://openknowledge.worldbank.org/bitstream/handle/10986/20524/922240PUB0978100Box385358B00PUBLIC0.pdf?sequence=1">Meier, P. Vagliasindi, M. Imran, M. Eberhard, A. & Siyambalapitiya, T. (2015). The Design and Sustainability of Renewable Energy Incentives: An Economic Analysis. Retrieved From: https://openknowledge.worldbank.org/bitstream/handle/10986/20524/922240PUB0978100Box385358B00PUBLIC0.pdf?sequence=1</ref><ref name="International Renewable Energy Agency (IRENA). International Energy Agency (IEA). & Renewable Energy Policy Network for the 21st Century (REN21). (2018). Renewable Energy Policies in a Time of Transition. Retrieved From: http://www.ren21.net/wp-content/uploads/2018/04/17-8622_Policy_FullReport_web_.pdf">International Renewable Energy Agency (IRENA). International Energy Agency (IEA). & Renewable Energy Policy Network for the 21st Century (REN21). (2018). Renewable Energy Policies in a Time of Transition. Retrieved From: http://www.ren21.net/wp-content/uploads/2018/04/17-8622_Policy_FullReport_web_.pdf</ref>.<br/> |
<br/> | <br/> | ||
| − | [[File:Economics of RE 02- Global Electricity Generation (IRENA et al., 2018).PNG|thumb|center| | + | [[File:Economics of RE 02- Global Electricity Generation (IRENA et al., 2018).PNG|thumb|center|850px|Global Electricity Generation (IRENA et al., 2018).PNG]] |
<br/> | <br/> | ||
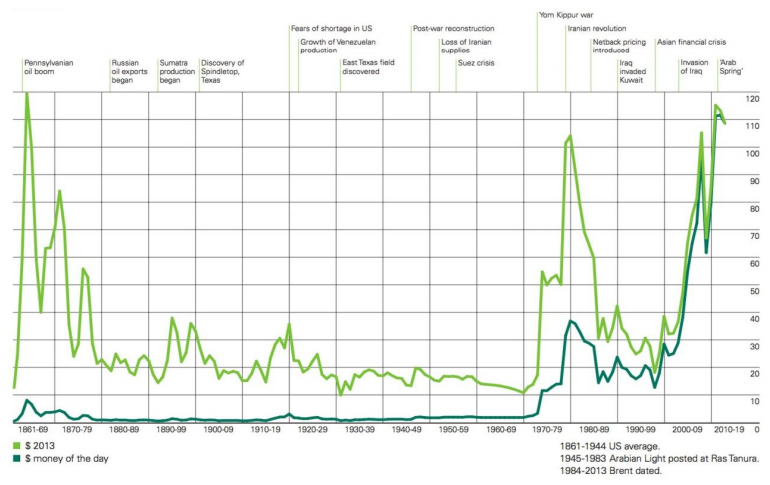
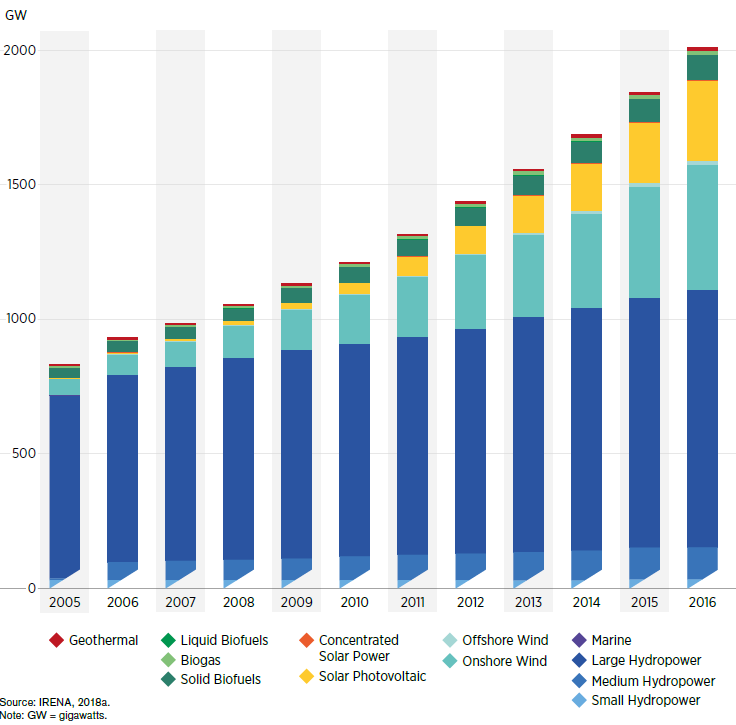
| − | The cost advantage that fossil fuels used to have over renewable energy sources has been decreasing recently, | + | The cost advantage that fossil fuels used to have over renewable energy sources has been decreasing recently, with some renewable technologies (Solar PV, wind, hydropower) already competing fossil fuels directly on the financial frontier<ref name="Timmons, D. Harris, J. M. & Roach, B. (2014). The Economics of Renewable Energy. Retrieved From: https://ase.tufts.edu/gdae/education_materials/modules/RenewableEnergyEcon.pdf">Timmons, D. Harris, J. M. & Roach, B. (2014). The Economics of Renewable Energy. Retrieved From: https://ase.tufts.edu/gdae/education_materials/modules/RenewableEnergyEcon.pdf</ref>. Furthermore, renewables' costs are expected to decline even further, and those of fossil fuels will incline<ref name="Timmons, D. Harris, J. M. & Roach, B. (2014). The Economics of Renewable Energy. Retrieved From: https://ase.tufts.edu/gdae/education_materials/modules/RenewableEnergyEcon.pdf">Timmons, D. Harris, J. M. & Roach, B. (2014). The Economics of Renewable Energy. Retrieved From: https://ase.tufts.edu/gdae/education_materials/modules/RenewableEnergyEcon.pdf</ref>. The following two figures show that -while on one hand- the oil prices are on the rise during the 2000s, on the other hand, investments in renewables are on the rise during the same period, thus reflecting its competitiveness against oil in recent years. |
<br/> | <br/> | ||
| − | [[File:Economics of RE 27- The Change in Crude Oil Prices (USD per Barrel) Since 1861 with Accordnace to Globa Major Events (Cottrell et al., 2015).PNG|thumb|center|850pxpx|The Change in Crude Oil Prices (USD per Barrel) Since 1861 with | + | [[File:Economics of RE 27- The Change in Crude Oil Prices (USD per Barrel) Since 1861 with Accordnace to Globa Major Events (Cottrell et al., 2015).PNG|thumb|center|850pxpx|The Change in Crude Oil Prices (USD per Barrel) Since 1861 with Accordance to Global Major Events (Cottrell et al., 2015)]] |
<br/> | <br/> | ||
| − | [[File:Economics of RE 04- Trends in RE Installed Capacity by Technology (IRENA et al., 2018).PNG|thumb|center| | + | [[File:Economics of RE 04- Trends in RE Installed Capacity by Technology (IRENA et al., 2018).PNG|thumb|center|850px|Trends in RE Installed Capacity by Technology (IRENA et al., 2018)]] |
<br/> | <br/> | ||
| Line 118: | Line 118: | ||
The renewables' market development during the past 10-15 years had few moving factors, which can be summarized as follows: | The renewables' market development during the past 10-15 years had few moving factors, which can be summarized as follows: | ||
| − | # | + | #One outcome of the Kyoto Protocol, entering into force in early 2005, was the exponential growth of global investment in renewables<ref name="Meier, P. Vagliasindi, M. Imran, M. Eberhard, A. & Siyambalapitiya, T. (2015). The Design and Sustainability of Renewable Energy Incentives: An Economic Analysis. Retrieved From: https://openknowledge.worldbank.org/bitstream/handle/10986/20524/922240PUB0978100Box385358B00PUBLIC0.pdf?sequence=1">Meier, P. Vagliasindi, M. Imran, M. Eberhard, A. & Siyambalapitiya, T. (2015). The Design and Sustainability of Renewable Energy Incentives: An Economic Analysis. Retrieved From: https://openknowledge.worldbank.org/bitstream/handle/10986/20524/922240PUB0978100Box385358B00PUBLIC0.pdf?sequence=1</ref>. |
| − | # | + | #Rapid growth in energy demand for emerging economies, such as the cases of China & India, which are driven by transforming their energy industries<ref name="Meier, P. Vagliasindi, M. Imran, M. Eberhard, A. & Siyambalapitiya, T. (2015). The Design and Sustainability of Renewable Energy Incentives: An Economic Analysis. Retrieved From: https://openknowledge.worldbank.org/bitstream/handle/10986/20524/922240PUB0978100Box385358B00PUBLIC0.pdf?sequence=1">Meier, P. Vagliasindi, M. Imran, M. Eberhard, A. & Siyambalapitiya, T. (2015). The Design and Sustainability of Renewable Energy Incentives: An Economic Analysis. Retrieved From: https://openknowledge.worldbank.org/bitstream/handle/10986/20524/922240PUB0978100Box385358B00PUBLIC0.pdf?sequence=1</ref><ref name="International Renewable Energy Agency (IRENA), International Energy Agency (IEA) & Renewable Energy Policy Network for the 21st Century (REN21). (2018). Renewable Energy Policies in a Time of Transition. Retrieved From: http://www.irena.org/-/media/Files/IRENA/Agency/Publication/2018/Apr/IRENA_IEA_REN21_Policies_2018.pdf">International Renewable Energy Agency (IRENA), International Energy Agency (IEA) & Renewable Energy Policy Network for the 21st Century (REN21). (2018). Renewable Energy Policies in a Time of Transition. Retrieved From: http://www.irena.org/-/media/Files/IRENA/Agency/Publication/2018/Apr/IRENA_IEA_REN21_Policies_2018.pdf</ref>. |
| − | # | + | #Uprising competition for energy sources<ref name="Meier, P. Vagliasindi, M. Imran, M. Eberhard, A. & Siyambalapitiya, T. (2015). The Design and Sustainability of Renewable Energy Incentives: An Economic Analysis. Retrieved From: https://openknowledge.worldbank.org/bitstream/handle/10986/20524/922240PUB0978100Box385358B00PUBLIC0.pdf?sequence=1">Meier, P. Vagliasindi, M. Imran, M. Eberhard, A. & Siyambalapitiya, T. (2015). The Design and Sustainability of Renewable Energy Incentives: An Economic Analysis. Retrieved From: https://openknowledge.worldbank.org/bitstream/handle/10986/20524/922240PUB0978100Box385358B00PUBLIC0.pdf?sequence=1</ref>. |
#Inclining geopolitical tension<ref name="Meier, P. Vagliasindi, M. Imran, M. Eberhard, A. & Siyambalapitiya, T. (2015). The Design and Sustainability of Renewable Energy Incentives: An Economic Analysis. Retrieved From: https://openknowledge.worldbank.org/bitstream/handle/10986/20524/922240PUB0978100Box385358B00PUBLIC0.pdf?sequence=1">Meier, P. Vagliasindi, M. Imran, M. Eberhard, A. & Siyambalapitiya, T. (2015). The Design and Sustainability of Renewable Energy Incentives: An Economic Analysis. Retrieved From: https://openknowledge.worldbank.org/bitstream/handle/10986/20524/922240PUB0978100Box385358B00PUBLIC0.pdf?sequence=1</ref>. | #Inclining geopolitical tension<ref name="Meier, P. Vagliasindi, M. Imran, M. Eberhard, A. & Siyambalapitiya, T. (2015). The Design and Sustainability of Renewable Energy Incentives: An Economic Analysis. Retrieved From: https://openknowledge.worldbank.org/bitstream/handle/10986/20524/922240PUB0978100Box385358B00PUBLIC0.pdf?sequence=1">Meier, P. Vagliasindi, M. Imran, M. Eberhard, A. & Siyambalapitiya, T. (2015). The Design and Sustainability of Renewable Energy Incentives: An Economic Analysis. Retrieved From: https://openknowledge.worldbank.org/bitstream/handle/10986/20524/922240PUB0978100Box385358B00PUBLIC0.pdf?sequence=1</ref>. | ||
#Energy security concerns<ref name="Meier, P. Vagliasindi, M. Imran, M. Eberhard, A. & Siyambalapitiya, T. (2015). The Design and Sustainability of Renewable Energy Incentives: An Economic Analysis. Retrieved From: https://openknowledge.worldbank.org/bitstream/handle/10986/20524/922240PUB0978100Box385358B00PUBLIC0.pdf?sequence=1">Meier, P. Vagliasindi, M. Imran, M. Eberhard, A. & Siyambalapitiya, T. (2015). The Design and Sustainability of Renewable Energy Incentives: An Economic Analysis. Retrieved From: https://openknowledge.worldbank.org/bitstream/handle/10986/20524/922240PUB0978100Box385358B00PUBLIC0.pdf?sequence=1</ref>. | #Energy security concerns<ref name="Meier, P. Vagliasindi, M. Imran, M. Eberhard, A. & Siyambalapitiya, T. (2015). The Design and Sustainability of Renewable Energy Incentives: An Economic Analysis. Retrieved From: https://openknowledge.worldbank.org/bitstream/handle/10986/20524/922240PUB0978100Box385358B00PUBLIC0.pdf?sequence=1">Meier, P. Vagliasindi, M. Imran, M. Eberhard, A. & Siyambalapitiya, T. (2015). The Design and Sustainability of Renewable Energy Incentives: An Economic Analysis. Retrieved From: https://openknowledge.worldbank.org/bitstream/handle/10986/20524/922240PUB0978100Box385358B00PUBLIC0.pdf?sequence=1</ref>. | ||
#Increasing prices of oil and gas<ref name="Meier, P. Vagliasindi, M. Imran, M. Eberhard, A. & Siyambalapitiya, T. (2015). The Design and Sustainability of Renewable Energy Incentives: An Economic Analysis. Retrieved From: https://openknowledge.worldbank.org/bitstream/handle/10986/20524/922240PUB0978100Box385358B00PUBLIC0.pdf?sequence=1">Meier, P. Vagliasindi, M. Imran, M. Eberhard, A. & Siyambalapitiya, T. (2015). The Design and Sustainability of Renewable Energy Incentives: An Economic Analysis. Retrieved From: https://openknowledge.worldbank.org/bitstream/handle/10986/20524/922240PUB0978100Box385358B00PUBLIC0.pdf?sequence=1</ref>. | #Increasing prices of oil and gas<ref name="Meier, P. Vagliasindi, M. Imran, M. Eberhard, A. & Siyambalapitiya, T. (2015). The Design and Sustainability of Renewable Energy Incentives: An Economic Analysis. Retrieved From: https://openknowledge.worldbank.org/bitstream/handle/10986/20524/922240PUB0978100Box385358B00PUBLIC0.pdf?sequence=1">Meier, P. Vagliasindi, M. Imran, M. Eberhard, A. & Siyambalapitiya, T. (2015). The Design and Sustainability of Renewable Energy Incentives: An Economic Analysis. Retrieved From: https://openknowledge.worldbank.org/bitstream/handle/10986/20524/922240PUB0978100Box385358B00PUBLIC0.pdf?sequence=1</ref>. | ||
| − | # | + | #Technological developments in the renewables' sector, and the emergence of more technology applications, especially generation of solar PV and wind power, which actually alone makes renewables more competitive, even without investment support<ref name="Yamamoto, Y. (2018). Feed-in Tariffs and the Economics of Renewable Energy. Retrieved From: https://www.springer.com/de/book/9783319768632">Yamamoto, Y. (2018). Feed-in Tariffs and the Economics of Renewable Energy. Retrieved From: https://www.springer.com/de/book/9783319768632</ref><ref name="Fraunhofer ISE. (2018). Levelized Cost of Electricity Renewable Energy Technologies. Retrieved From: https://www.ise.fraunhofer.de/content/dam/ise/en/documents/publications/studies/EN2018_Fraunhofer-ISE_LCOE_Renewable_Energy_Technologies.pdf">Fraunhofer ISE. (2018). Levelized Cost of Electricity Renewable Energy Technologies. Retrieved From: https://www.ise.fraunhofer.de/content/dam/ise/en/documents/publications/studies/EN2018_Fraunhofer-ISE_LCOE_Renewable_Energy_Technologies.pdf</ref>. |
| − | #The | + | #The need to commit to a long-term sustainable energy targets has further improved the climate for investments in renewables<ref name="Fraunhofer ISE. (2018). Levelized Cost of Electricity Renewable Energy Technologies. Retrieved From: https://www.ise.fraunhofer.de/content/dam/ise/en/documents/publications/studies/EN2018_Fraunhofer-ISE_LCOE_Renewable_Energy_Technologies.pdf">Fraunhofer ISE. (2018). Levelized Cost of Electricity Renewable Energy Technologies. Retrieved From: https://www.ise.fraunhofer.de/content/dam/ise/en/documents/publications/studies/EN2018_Fraunhofer-ISE_LCOE_Renewable_Energy_Technologies.pdf</ref>. |
| − | # | + | #Positive support of policy and law-makers in various countries, promoting scarcity of fossil fuels, their on-the-rise prices and climate challenges, which require adopting different energy approaches<ref name="Fraunhofer ISE. (2018). Levelized Cost of Electricity Renewable Energy Technologies. Retrieved From: https://www.ise.fraunhofer.de/content/dam/ise/en/documents/publications/studies/EN2018_Fraunhofer-ISE_LCOE_Renewable_Energy_Technologies.pdf">Fraunhofer ISE. (2018). Levelized Cost of Electricity Renewable Energy Technologies. Retrieved From: https://www.ise.fraunhofer.de/content/dam/ise/en/documents/publications/studies/EN2018_Fraunhofer-ISE_LCOE_Renewable_Energy_Technologies.pdf</ref><ref name="https://ourworldindata.org/how-long-before-we-run-out-of-fossil-fuels">https://ourworldindata.org/how-long-before-we-run-out-of-fossil-fuels</ref>. |
| − | # | + | #Intensive research efforts, leading to improved system solutions with much higher efficiencies and lower production and operation costs<ref name="Fraunhofer ISE. (2018). Levelized Cost of Electricity Renewable Energy Technologies. Retrieved From: https://www.ise.fraunhofer.de/content/dam/ise/en/documents/publications/studies/EN2018_Fraunhofer-ISE_LCOE_Renewable_Energy_Technologies.pdf">Fraunhofer ISE. (2018). Levelized Cost of Electricity Renewable Energy Technologies. Retrieved From: https://www.ise.fraunhofer.de/content/dam/ise/en/documents/publications/studies/EN2018_Fraunhofer-ISE_LCOE_Renewable_Energy_Technologies.pdf</ref>. |
<br/> | <br/> | ||
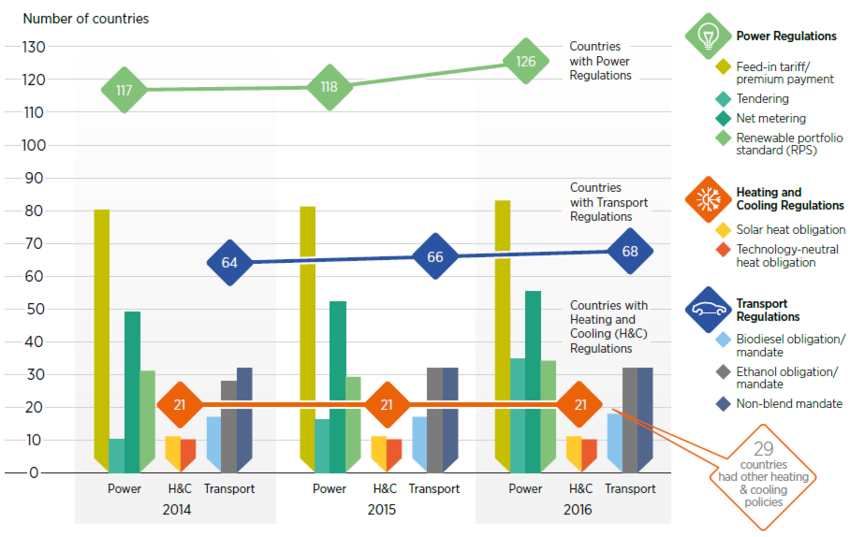
| − | [[File:Economics of RE 01- RE Costs Declining, Policy & Regulations in Different Sectors Inclining (IRENA et al., 2018).PNG|thumb|center| | + | [[File:Economics of RE 01- RE Costs Declining, Policy & Regulations in Different Sectors Inclining (IRENA et al., 2018).PNG|thumb|center|850px|RE Costs Declining, Policy & Regulations in Different Sectors Inclining (IRENA et al., 2018)]] |
<br/> | <br/> | ||
| Line 139: | Line 139: | ||
== Costs of Renewables == | == Costs of Renewables == | ||
| − | According the most recent reports on renewable energy technologies, from IRENA, REN21 and IEA, electricity costs from almost all the renewable projects that were commissioned in 2017, have continued to decline<ref name="International Renewable Energy Agency (IRENA), International Energy Agency (IEA) & Renewable Energy Policy Network for the 21st Century (REN21). (2018). Renewable Energy Policies in a Time of Transition. Retrieved From: http://www.irena.org/-/media/Files/IRENA/Agency/Publication/2018/Apr/IRENA_IEA_REN21_Policies_2018.pdf">International Renewable Energy Agency (IRENA), International Energy Agency (IEA) & Renewable Energy Policy Network for the 21st Century (REN21). (2018). Renewable Energy Policies in a Time of Transition. Retrieved From: http://www.irena.org/-/media/Files/IRENA/Agency/Publication/2018/Apr/IRENA_IEA_REN21_Policies_2018.pdf</ref><ref name="International Renewable Energy Agency (IRENA). (2017). Renewable Power Generation Costs in 2017. Retrieve From: https://www.irena.org/-/media/Files/IRENA/Agency/Publication/2018/Jan/IRENA_2017_Power_Costs_2018.pdf">International Renewable Energy Agency (IRENA). (2017). Renewable Power Generation Costs in 2017. Retrieve From: https://www.irena.org/-/media/Files/IRENA/Agency/Publication/2018/Jan/IRENA_2017_Power_Costs_2018.pdf</ref><ref name="REN21. (2017). Renewables Global Futures Report: Great Debates towards 100% Renewable Energy. Retrieved From: http://www.ren21.net/wp-content/uploads/2017/10/GFR-Full-Report-2017_webversion_3.pdf">REN21. (2017). Renewables Global Futures Report: Great Debates towards 100% Renewable Energy. Retrieved From: http://www.ren21.net/wp-content/uploads/2017/10/GFR-Full-Report-2017_webversion_3.pdf</ref>. Projects of bioenergy power, hydropower, geothermal and onshore wind, which were commissioned in that year, have widely fallen into the generation costs' range of fossil-generated electricity, and furthermore, some of these projects have actually undercut those of fossil fuels-based ones<ref name="International Renewable Energy Agency (IRENA). (2017). Renewable Power Generation Costs in 2017. Retrieve From: https://www.irena.org/-/media/Files/IRENA/Agency/Publication/2018/Jan/IRENA_2017_Power_Costs_2018.pdf">International Renewable Energy Agency (IRENA). (2017). Renewable Power Generation Costs in 2017. Retrieve From: https://www.irena.org/-/media/Files/IRENA/Agency/Publication/2018/Jan/IRENA_2017_Power_Costs_2018.pdf</ref>. | + | According to the most recent reports on renewable energy technologies, from IRENA, REN21 and IEA, electricity costs from almost all the renewable projects that were commissioned in 2017, have continued to decline<ref name="International Renewable Energy Agency (IRENA), International Energy Agency (IEA) & Renewable Energy Policy Network for the 21st Century (REN21). (2018). Renewable Energy Policies in a Time of Transition. Retrieved From: http://www.irena.org/-/media/Files/IRENA/Agency/Publication/2018/Apr/IRENA_IEA_REN21_Policies_2018.pdf">International Renewable Energy Agency (IRENA), International Energy Agency (IEA) & Renewable Energy Policy Network for the 21st Century (REN21). (2018). Renewable Energy Policies in a Time of Transition. Retrieved From: http://www.irena.org/-/media/Files/IRENA/Agency/Publication/2018/Apr/IRENA_IEA_REN21_Policies_2018.pdf</ref><ref name="International Renewable Energy Agency (IRENA). (2017). Renewable Power Generation Costs in 2017. Retrieve From: https://www.irena.org/-/media/Files/IRENA/Agency/Publication/2018/Jan/IRENA_2017_Power_Costs_2018.pdf">International Renewable Energy Agency (IRENA). (2017). Renewable Power Generation Costs in 2017. Retrieve From: https://www.irena.org/-/media/Files/IRENA/Agency/Publication/2018/Jan/IRENA_2017_Power_Costs_2018.pdf</ref><ref name="REN21. (2017). Renewables Global Futures Report: Great Debates towards 100% Renewable Energy. Retrieved From: http://www.ren21.net/wp-content/uploads/2017/10/GFR-Full-Report-2017_webversion_3.pdf">REN21. (2017). Renewables Global Futures Report: Great Debates towards 100% Renewable Energy. Retrieved From: http://www.ren21.net/wp-content/uploads/2017/10/GFR-Full-Report-2017_webversion_3.pdf</ref>. Projects of bioenergy power, hydropower, geothermal and onshore wind, which were commissioned in that year, have widely fallen into the generation costs' range of fossil-generated electricity, and furthermore, some of these projects have actually undercut those of fossil fuels-based ones<ref name="International Renewable Energy Agency (IRENA). (2017). Renewable Power Generation Costs in 2017. Retrieve From: https://www.irena.org/-/media/Files/IRENA/Agency/Publication/2018/Jan/IRENA_2017_Power_Costs_2018.pdf">International Renewable Energy Agency (IRENA). (2017). Renewable Power Generation Costs in 2017. Retrieve From: https://www.irena.org/-/media/Files/IRENA/Agency/Publication/2018/Jan/IRENA_2017_Power_Costs_2018.pdf</ref>. |
<br/> | <br/> | ||
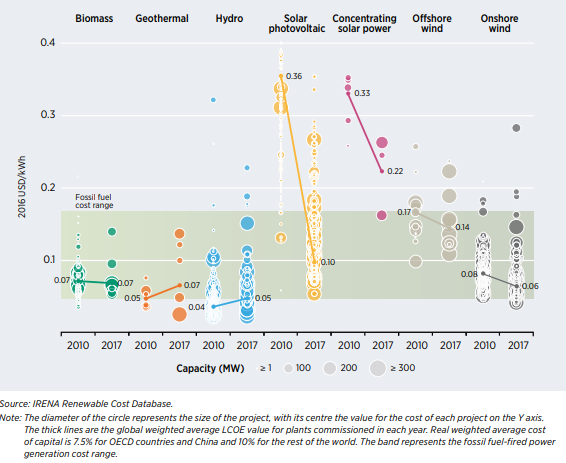
| − | [[File:Economics of RE 06- Global LCOE from Utility-Scale Renewable Power Generation Technologies (IRENA, 2017).PNG|thumb|center|850pxpx|Global LCOE from Utility-Scale Renewable Power Generation Technologies (IRENA, 2017)]] | + | [[File:Economics of RE 06- Global LCOE from Utility-Scale Renewable Power Generation Technologies (IRENA, 2017).PNG|thumb|center|850pxpx|Global Levelized Cost of Energy (LCOE) from Utility-Scale Renewable Power Generation Technologies (IRENA, 2017)]] |
<br/> | <br/> | ||
| − | The most common methodology for comparing different energy sources, is to calculate the Levelized Cost Of Energy ('''LCOE'''), | + | The most common methodology for comparing different energy sources, is to calculate the Levelized Cost Of Energy ('''LCOE'''). LCOE measures lifetime costs, including building and operation of a power plant, divided by lifetime energy production/output<ref name="Fraunhofer ISE. (2018). Levelized Cost of Electricity Renewable Energy Technologies. Retrieved From: https://www.ise.fraunhofer.de/content/dam/ise/en/documents/publications/studies/EN2018_Fraunhofer-ISE_LCOE_Renewable_Energy_Technologies.pdf">Fraunhofer ISE. (2018). Levelized Cost of Electricity Renewable Energy Technologies. Retrieved From: https://www.ise.fraunhofer.de/content/dam/ise/en/documents/publications/studies/EN2018_Fraunhofer-ISE_LCOE_Renewable_Energy_Technologies.pdf</ref><ref name="International Renewable Energy Agency (IRENA). (2017). Renewable Power Generation Costs in 2017. Retrieve From: https://www.irena.org/-/media/Files/IRENA/Agency/Publication/2018/Jan/IRENA_2017_Power_Costs_2018.pdf">International Renewable Energy Agency (IRENA). (2017). Renewable Power Generation Costs in 2017. Retrieve From: https://www.irena.org/-/media/Files/IRENA/Agency/Publication/2018/Jan/IRENA_2017_Power_Costs_2018.pdf</ref><ref name="Timmons, D. Harris, J. M. & Roach, B. (2014). The Economics of Renewable Energy. Retrieved From: https://ase.tufts.edu/gdae/education_materials/modules/RenewableEnergyEcon.pdf">Timmons, D. Harris, J. M. & Roach, B. (2014). The Economics of Renewable Energy. Retrieved From: https://ase.tufts.edu/gdae/education_materials/modules/RenewableEnergyEcon.pdf</ref>. |
<br/> | <br/> | ||
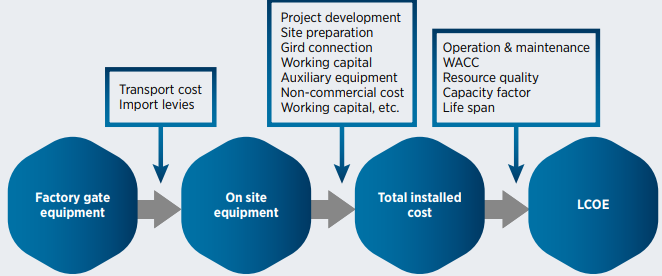
| − | [[File:Economics of RE 14- Cost metric analysis for the calculation of LCOE (IRENA, 2017).PNG|thumb|center| | + | [[File:Economics of RE 14- Cost metric analysis for the calculation of LCOE (IRENA, 2017).PNG|thumb|center|850px|Cost metric analysis for the calculation of LCOE (IRENA, 2017)]]<br/> |
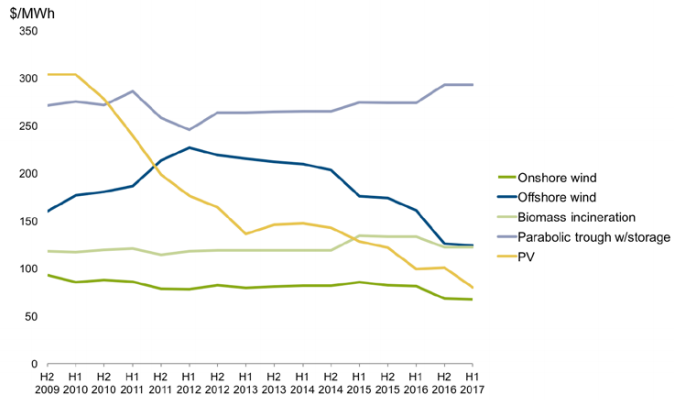
| − | [[File:Economics of RE 18- LCOE of Electricity by Renewables ($ per MWH) 2009-2017 (FS-UNEP, 2018).PNG|thumb|center| | + | [[File:Economics of RE 18- LCOE of Electricity by Renewables ($ per MWH) 2009-2017 (FS-UNEP, 2018).PNG|thumb|center|850px|LCOE of Electricity by Renewables ($ per MWH) 2009-2017 (FS-UNEP, 2018)]] |
<br/> | <br/> | ||
| − | Global weighted LCOE of utility-scale solar PV has witnessed a remarkable drop (approximately 27%) since 2010, reaching USD 0.10/kWh for the new commissioned projects in 2017 | + | As shown in the figure above, Global weighted LCOE of utility-scale solar PV has witnessed a remarkable drop (approximately 27%) since 2010, reaching USD 0.10/kWh for the new commissioned projects in 2017<ref name="International Renewable Energy Agency (IRENA). (2017). Renewable Power Generation Costs in 2017. Retrieve From: https://www.irena.org/-/media/Files/IRENA/Agency/Publication/2018/Jan/IRENA_2017_Power_Costs_2018.pdf">International Renewable Energy Agency (IRENA). (2017). Renewable Power Generation Costs in 2017. Retrieve From: https://www.irena.org/-/media/Files/IRENA/Agency/Publication/2018/Jan/IRENA_2017_Power_Costs_2018.pdf</ref>. Under the right conditions, it will potentially decline to USD 0.03/kWh from 2018 onward<ref name="International Renewable Energy Agency (IRENA). (2017). Renewable Power Generation Costs in 2017. Retrieve From: https://www.irena.org/-/media/Files/IRENA/Agency/Publication/2018/Jan/IRENA_2017_Power_Costs_2018.pdf">International Renewable Energy Agency (IRENA). (2017). Renewable Power Generation Costs in 2017. Retrieve From: https://www.irena.org/-/media/Files/IRENA/Agency/Publication/2018/Jan/IRENA_2017_Power_Costs_2018.pdf</ref>. |
<br/> | <br/> | ||
| − | Onshore wind is already one of t<span style="background-color: rgb(255, 255, 255);">he most competitive sources for generation capacity | + | Onshore wind is already one of t<span style="background-color: rgb(255, 255, 255);">he most competitive sources for generation capacity. Recent auctions in Brazil, Canada, Germany, India, Mexico and Morocco have resulted in LCOE as low as USD 0.03/kWh<ref name="International Renewable Energy Agency (IRENA). (2017). Renewable Power Generation Costs in 2017. Retrieve From: https://www.irena.org/-/media/Files/IRENA/Agency/Publication/2018/Jan/IRENA_2017_Power_Costs_2018.pdf">International Renewable Energy Agency (IRENA). (2017). Renewable Power Generation Costs in 2017. Retrieve From: https://www.irena.org/-/media/Files/IRENA/Agency/Publication/2018/Jan/IRENA_2017_Power_Costs_2018.pdf</ref>.</span> |
<br/> | <br/> | ||
| Line 169: | Line 169: | ||
<br/> | <br/> | ||
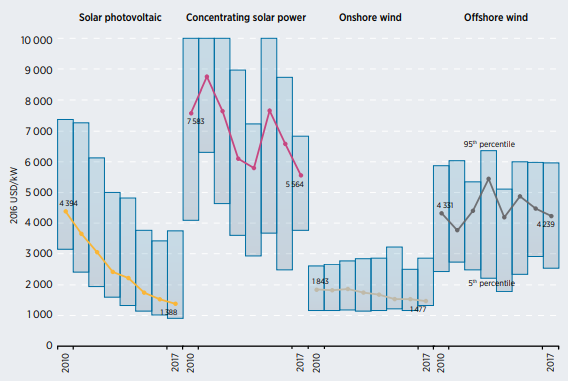
| − | [[File:Economics of RE 09- Global weighted average total installed costs and project percentage ranges for CSP, Solar PV, Onshore & Offshore wind 2010-2017 (IRENA, 2017).PNG|thumb|center| | + | [[File:Economics of RE 09- Global weighted average total installed costs and project percentage ranges for CSP, Solar PV, Onshore & Offshore wind 2010-2017 (IRENA, 2017).PNG|thumb|center|850px|Global weighted average total installed costs and project percentage ranges for CSP, Solar PV, Onshore & Offshore wind 2010-2017 (IRENA, 2017)]] |
<br/> | <br/> | ||
| Line 212: | Line 212: | ||
<br/> | <br/> | ||
| − | Based on current installed projects and auction data, in combination with mass production increase and specific investment costs, electricity from renewables -sooner rather than later- will be cheaper than that from fossil fuels<ref name="Fraunhofer ISE. (2018). Levelized Cost of Electricity Renewable Energy Technologies. Retrieved From: https://www.ise.fraunhofer.de/content/dam/ise/en/documents/publications/studies/EN2018_Fraunhofer-ISE_LCOE_Renewable_Energy_Technologies.pdf">Fraunhofer ISE. (2018). Levelized Cost of Electricity Renewable Energy Technologies. Retrieved From: https://www.ise.fraunhofer.de/content/dam/ise/en/documents/publications/studies/EN2018_Fraunhofer-ISE_LCOE_Renewable_Energy_Technologies.pdf</ref><ref name="International Renewable Energy Agency (IRENA). (2017). Renewable Power Generation Costs in 2017. Retrieve From: https://www.irena.org/-/media/Files/IRENA/Agency/Publication/2018/Jan/IRENA_2017_Power_Costs_2018.pdf">International Renewable Energy Agency (IRENA). (2017). Renewable Power Generation Costs in 2017. Retrieve From: https://www.irena.org/-/media/Files/IRENA/Agency/Publication/2018/Jan/IRENA_2017_Power_Costs_2018.pdf</ref>. | + | Based on current installed projects and auction data, in combination with mass production increase and specific investment costs, electricity from renewables -sooner rather than later- will be cheaper than that from fossil fuels<ref name="Fraunhofer ISE. (2018). Levelized Cost of Electricity Renewable Energy Technologies. Retrieved From: https://www.ise.fraunhofer.de/content/dam/ise/en/documents/publications/studies/EN2018_Fraunhofer-ISE_LCOE_Renewable_Energy_Technologies.pdf">Fraunhofer ISE. (2018). Levelized Cost of Electricity Renewable Energy Technologies. Retrieved From: https://www.ise.fraunhofer.de/content/dam/ise/en/documents/publications/studies/EN2018_Fraunhofer-ISE_LCOE_Renewable_Energy_Technologies.pdf</ref><ref name="International Renewable Energy Agency (IRENA). (2017). Renewable Power Generation Costs in 2017. Retrieve From: https://www.irena.org/-/media/Files/IRENA/Agency/Publication/2018/Jan/IRENA_2017_Power_Costs_2018.pdf">International Renewable Energy Agency (IRENA). (2017). Renewable Power Generation Costs in 2017. Retrieve From: https://www.irena.org/-/media/Files/IRENA/Agency/Publication/2018/Jan/IRENA_2017_Power_Costs_2018.pdf</ref>. All the renewable power generation technologies are expected to fall within the fossil fuel cost range, with the majority having the potential to undercut it<ref name="Fraunhofer ISE. (2018). Levelized Cost of Electricity Renewable Energy Technologies. Retrieved From: https://www.ise.fraunhofer.de/content/dam/ise/en/documents/publications/studies/EN2018_Fraunhofer-ISE_LCOE_Renewable_Energy_Technologies.pdf">Fraunhofer ISE. (2018). Levelized Cost of Electricity Renewable Energy Technologies. Retrieved From: https://www.ise.fraunhofer.de/content/dam/ise/en/documents/publications/studies/EN2018_Fraunhofer-ISE_LCOE_Renewable_Energy_Technologies.pdf</ref><ref name="International Renewable Energy Agency (IRENA). (2017). Renewable Power Generation Costs in 2017. Retrieve From: https://www.irena.org/-/media/Files/IRENA/Agency/Publication/2018/Jan/IRENA_2017_Power_Costs_2018.pdf">International Renewable Energy Agency (IRENA). (2017). Renewable Power Generation Costs in 2017. Retrieve From: https://www.irena.org/-/media/Files/IRENA/Agency/Publication/2018/Jan/IRENA_2017_Power_Costs_2018.pdf</ref>. This will significantly lower the LCOE of all technologies, eventually leading to a market potential increase and development for renewables<ref name="Fraunhofer ISE. (2018). Levelized Cost of Electricity Renewable Energy Technologies. Retrieved From: https://www.ise.fraunhofer.de/content/dam/ise/en/documents/publications/studies/EN2018_Fraunhofer-ISE_LCOE_Renewable_Energy_Technologies.pdf">Fraunhofer ISE. (2018). Levelized Cost of Electricity Renewable Energy Technologies. Retrieved From: https://www.ise.fraunhofer.de/content/dam/ise/en/documents/publications/studies/EN2018_Fraunhofer-ISE_LCOE_Renewable_Energy_Technologies.pdf</ref><ref name="International Renewable Energy Agency (IRENA). (2017). Renewable Power Generation Costs in 2017. Retrieve From: https://www.irena.org/-/media/Files/IRENA/Agency/Publication/2018/Jan/IRENA_2017_Power_Costs_2018.pdf">International Renewable Energy Agency (IRENA). (2017). Renewable Power Generation Costs in 2017. Retrieve From: https://www.irena.org/-/media/Files/IRENA/Agency/Publication/2018/Jan/IRENA_2017_Power_Costs_2018.pdf</ref>. |
| − | |||
| − | |||
| − | |||
| − | |||
<br/> | <br/> | ||
| Line 378: | Line 374: | ||
*Climate change has been described as the "biggest market failure in history" (Stern Review, 2006) because the environmental costs associated with carbon emissions are not included in market prices.<br/> | *Climate change has been described as the "biggest market failure in history" (Stern Review, 2006) because the environmental costs associated with carbon emissions are not included in market prices.<br/> | ||
*Furthermore, fossil fuels are [[Subsidies|subsidized]] for about US$300 billion per year. Removing theses subsidies and incorporating externalities into fossil fuel costs would dramatically change relative costs<ref name="Griffith-Jones, S., Ocampo, J. A. & Spratt, S., 2011. Financing Renewable Energy in Developing Countries: Mechanisms and Responsibilities. Available at: http://erd-report.eu/erd/report_2011/documents/dev-11-001-11researchpapers_griffith-jones-ocampo-spratt.pdf">Griffith-Jones, S., Ocampo, J. A. & Spratt, S., 2011. Financing Renewable Energy in Developing Countries: Mechanisms and Responsibilities. Available at: http://erd-report.eu/erd/report_2011/documents/dev-11-001-11researchpapers_griffith-jones-ocampo-spratt.pdf</ref>. | *Furthermore, fossil fuels are [[Subsidies|subsidized]] for about US$300 billion per year. Removing theses subsidies and incorporating externalities into fossil fuel costs would dramatically change relative costs<ref name="Griffith-Jones, S., Ocampo, J. A. & Spratt, S., 2011. Financing Renewable Energy in Developing Countries: Mechanisms and Responsibilities. Available at: http://erd-report.eu/erd/report_2011/documents/dev-11-001-11researchpapers_griffith-jones-ocampo-spratt.pdf">Griffith-Jones, S., Ocampo, J. A. & Spratt, S., 2011. Financing Renewable Energy in Developing Countries: Mechanisms and Responsibilities. Available at: http://erd-report.eu/erd/report_2011/documents/dev-11-001-11researchpapers_griffith-jones-ocampo-spratt.pdf</ref>. | ||
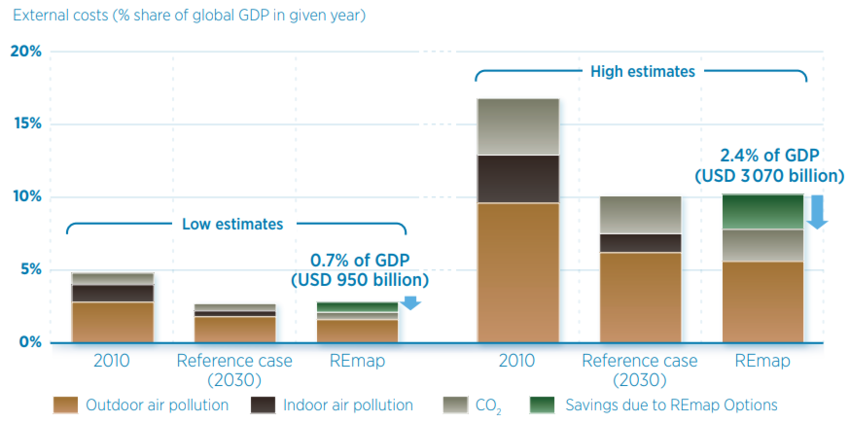
| − | *Also the external costs which are related to the use of fossil fuels, stemming from different causes: pollution and environmental degradation as a consequence of extraction of resources, indoor and outdoor air pollution, | + | *Also the external costs which are related to the use of fossil fuels, stemming from different causes: pollution and environmental degradation as a consequence of extraction of resources, indoor and outdoor air pollution, resulting from direct fuel combustion, as well as non-combustion emissions (e.g. industrial processes)<ref name="Markandya, A. Saygin, D. Miketa, A. Gielen, D. & Wagner, N. (2016). The True Cost of Fossil Fuels: Saving on the Externalities of Air Pollution and Climate Change. Retrieved From: https://www.irena.org/-/media/Files/IRENA/Agency/Publication/2016/IRENA_REmap_externality_brief_2016.pdf">Markandya, A. Saygin, D. Miketa, A. Gielen, D. & Wagner, N. (2016). The True Cost of Fossil Fuels: Saving on the Externalities of Air Pollution and Climate Change. Retrieved From: https://www.irena.org/-/media/Files/IRENA/Agency/Publication/2016/IRENA_REmap_externality_brief_2016.pdf</ref>. |
<br/> | <br/> | ||
| − | [[File:Economics of RE 27- External Costs as a Share of GDP & Possible Reduced Externalities with IRENA's Renewable Energy Map Tool's Options (Markandya et al., 2016).PNG|thumb|center| | + | [[File:Economics of RE 27- External Costs as a Share of GDP & Possible Reduced Externalities with IRENA's Renewable Energy Map Tool's Options (Markandya et al., 2016).PNG|thumb|center|850px|External Costs as a Share of GDP & Possible Reduced Externalities with IRENA's Renewable Energy Map Tool's Options (Markandya et al., 2016)]] |
<br/> | <br/> | ||
| − | *Further side effects, which also could add to the externalities, | + | *Further side effects, which also could add to the externalities, as fossil fuels produce: Sulphur oxide SO<sub>2</sub>, mono-nitrogen oxides NO<sub>x</sub>, particular emissions PM<sub>2.5</sub>, ammonia NH<sub>3</sub> and volatile organic compounds VOCs, which can cause: adverse human health effects, reducing agricultural yields, damaging forests, buildings, and infrastructure<ref name="Markandya, A. Saygin, D. Miketa, A. Gielen, D. & Wagner, N. (2016). The True Cost of Fossil Fuels: Saving on the Externalities of Air Pollution and Climate Change. Retrieved From: https://www.irena.org/-/media/Files/IRENA/Agency/Publication/2016/IRENA_REmap_externality_brief_2016.pdf">Markandya, A. Saygin, D. Miketa, A. Gielen, D. & Wagner, N. (2016). The True Cost of Fossil Fuels: Saving on the Externalities of Air Pollution and Climate Change. Retrieved From: https://www.irena.org/-/media/Files/IRENA/Agency/Publication/2016/IRENA_REmap_externality_brief_2016.pdf</ref> |
| − | *Currently, the climate change | + | *Currently, the climate change and air pollution's external effects -alone- are approximately in the range of 2.2-5.9 trillion USD per year, while the all-in-all cost of the global energy supply is around 5 trillion USD per year<ref name="Markandya, A. Saygin, D. Miketa, A. Gielen, D. & Wagner, N. (2016). The True Cost of Fossil Fuels: Saving on the Externalities of Air Pollution and Climate Change. Retrieved From: https://www.irena.org/-/media/Files/IRENA/Agency/Publication/2016/IRENA_REmap_externality_brief_2016.pdf">Markandya, A. Saygin, D. Miketa, A. Gielen, D. & Wagner, N. (2016). The True Cost of Fossil Fuels: Saving on the Externalities of Air Pollution and Climate Change. Retrieved From: https://www.irena.org/-/media/Files/IRENA/Agency/Publication/2016/IRENA_REmap_externality_brief_2016.pdf</ref>. The externalities of air pollution, caused by fossil fuels in Europe alone, were recorded ranging between 330 billion-940 billion USD in 2010<ref name="Markandya, A. Saygin, D. Miketa, A. Gielen, D. & Wagner, N. (2016). The True Cost of Fossil Fuels: Saving on the Externalities of Air Pollution and Climate Change. Retrieved From: https://www.irena.org/-/media/Files/IRENA/Agency/Publication/2016/IRENA_REmap_externality_brief_2016.pdf">Markandya, A. Saygin, D. Miketa, A. Gielen, D. & Wagner, N. (2016). The True Cost of Fossil Fuels: Saving on the Externalities of Air Pollution and Climate Change. Retrieved From: https://www.irena.org/-/media/Files/IRENA/Agency/Publication/2016/IRENA_REmap_externality_brief_2016.pdf</ref>. |
<br/> | <br/> | ||
| Line 393: | Line 389: | ||
'''2. It is more expensive to deliver non-renewable energy in some places than others.'''<br/> | '''2. It is more expensive to deliver non-renewable energy in some places than others.'''<br/> | ||
| − | *For example, rural communities in developing countries are often not connected to the [[Portal:Grid|grid]], resulting in "off-grid" energy production - particularly solar power - being more competitive<ref name="Griffith-Jones, S., Ocampo, J. A. & Spratt, S., 2011. Financing Renewable Energy in Developing Countries: Mechanisms and Responsibilities. Available at: http://erd-report.eu/erd/report_2011/documents/dev-11-001-11researchpapers_griffith-jones-ocampo-spratt.pdf">Griffith-Jones, S., Ocampo, J. A. & Spratt, S., 2011. Financing Renewable Energy in Developing Countries: Mechanisms and Responsibilities. Available at: http://erd-report.eu/erd/report_2011/documents/dev-11-001-11researchpapers_griffith-jones-ocampo-spratt.pdf</ref>. | + | *For example, rural or remote communities in developing countries are often not connected to the [[Portal:Grid|grid]], resulting in "off-grid" energy production - particularly solar power - being more competitive than extending the grid<ref name="Griffith-Jones, S., Ocampo, J. A. & Spratt, S., 2011. Financing Renewable Energy in Developing Countries: Mechanisms and Responsibilities. Available at: http://erd-report.eu/erd/report_2011/documents/dev-11-001-11researchpapers_griffith-jones-ocampo-spratt.pdf">Griffith-Jones, S., Ocampo, J. A. & Spratt, S., 2011. Financing Renewable Energy in Developing Countries: Mechanisms and Responsibilities. Available at: http://erd-report.eu/erd/report_2011/documents/dev-11-001-11researchpapers_griffith-jones-ocampo-spratt.pdf</ref>. |
<br/> | <br/> | ||
| − | '''3. Fossil Fuels are fast depleting and | + | '''3. Fossil Fuels are fast depleting and scarcer than RE''' |
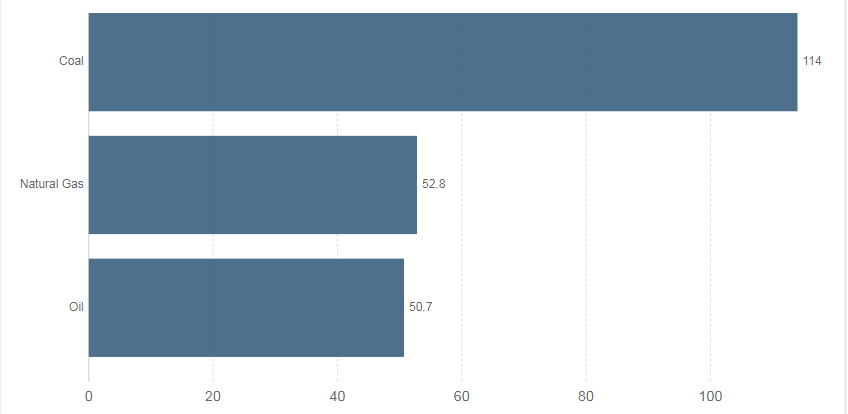
| − | * | + | *Fossil fuels are finite, as upon being consumed long enough, global resources will eventually run out<ref name="Ritchie, H. (2017). How Long Before We Run Out of Fossil Fuels?. Retrieved From: https://ourworldindata.org/how-long-before-we-run-out-of-fossil-fuels">Ritchie, H. (2017). How Long Before We Run Out of Fossil Fuels?. Retrieved From: https://ourworldindata.org/how-long-before-we-run-out-of-fossil-fuels</ref>. |
| − | * | + | *For a proper estimate of how long can current fossil fuel reserves be consumed for, the following figure (Fig,16), has been plotted by dividing the quantity of known fuel reserves by the current rate of production (Reserves-to-Production R/P)<ref name="Ritchie, H. (2017). How Long Before We Run Out of Fossil Fuels?. Retrieved From: https://ourworldindata.org/how-long-before-we-run-out-of-fossil-fuels">Ritchie, H. (2017). How Long Before We Run Out of Fossil Fuels?. Retrieved From: https://ourworldindata.org/how-long-before-we-run-out-of-fossil-fuels</ref>. |
<br/> | <br/> | ||
| − | [[File:Economics of RE 28- Years of Fossil Fuel Reserves Left (Ritchie, 2017).PNG|thumb|center| | + | [[File:Economics of RE 28- Years of Fossil Fuel Reserves Left (Ritchie, 2017).PNG|thumb|center|850px|Years of Fossil Fuel Reserves Left (Ritchie, 2017)]] |
<br/> | <br/> | ||
| Line 410: | Line 406: | ||
== Market Competition - Renewables V.s. Fossil Fuels == | == Market Competition - Renewables V.s. Fossil Fuels == | ||
| − | As the markets develop, the costs normally do as well, as both developments go hand in hand<ref name="REN21. (2017). Renewables Global Futures Report: Great Debates towards 100% Renewable Energy. Retrieved From: http://www.ren21.net/wp-content/uploads/2017/10/GFR-Full-Report-2017_webversion_3.pdf">REN21. (2017). Renewables Global Futures Report: Great Debates towards 100% Renewable Energy. Retrieved From: http://www.ren21.net/wp-content/uploads/2017/10/GFR-Full-Report-2017_webversion_3.pdf</ref><ref name="Timmons, D. Harris, J. M. & Roach, B. (2014). The Economics of Renewable Energy. Retrieved From: https://ase.tufts.edu/gdae/education_materials/modules/RenewableEnergyEcon.pdf">Timmons, D. Harris, J. M. & Roach, B. (2014). The Economics of Renewable Energy. Retrieved From: https://ase.tufts.edu/gdae/education_materials/modules/RenewableEnergyEcon.pdf</ref>. The previously mentioned factors push the market to increase its renewables' volume, leading to economies of scale. On one hand, this reduces the price and later the actual costs of the | + | As the markets develop, the costs normally do as well, as both developments go hand in hand<ref name="REN21. (2017). Renewables Global Futures Report: Great Debates towards 100% Renewable Energy. Retrieved From: http://www.ren21.net/wp-content/uploads/2017/10/GFR-Full-Report-2017_webversion_3.pdf">REN21. (2017). Renewables Global Futures Report: Great Debates towards 100% Renewable Energy. Retrieved From: http://www.ren21.net/wp-content/uploads/2017/10/GFR-Full-Report-2017_webversion_3.pdf</ref><ref name="Timmons, D. Harris, J. M. & Roach, B. (2014). The Economics of Renewable Energy. Retrieved From: https://ase.tufts.edu/gdae/education_materials/modules/RenewableEnergyEcon.pdf">Timmons, D. Harris, J. M. & Roach, B. (2014). The Economics of Renewable Energy. Retrieved From: https://ase.tufts.edu/gdae/education_materials/modules/RenewableEnergyEcon.pdf</ref>. The previously mentioned factors push the market to increase its renewables' volume, leading to economies of scale. On one hand, this reduces the price and later the actual costs of the technology, while on the other hand, reduced prices increase market volumes, again producing economies of scale, eventually resulting in a feedback loop, that either way paves the path for renewables<ref name="REN21. (2017). Renewables Global Futures Report: Great Debates towards 100% Renewable Energy. Retrieved From: http://www.ren21.net/wp-content/uploads/2017/10/GFR-Full-Report-2017_webversion_3.pdf">REN21. (2017). Renewables Global Futures Report: Great Debates towards 100% Renewable Energy. Retrieved From: http://www.ren21.net/wp-content/uploads/2017/10/GFR-Full-Report-2017_webversion_3.pdf</ref><ref name="International Renewable Energy Agency (IRENA). (2017). Renewable Power Generation Costs in 2017. Retrieve From: https://www.irena.org/-/media/Files/IRENA/Agency/Publication/2018/Jan/IRENA_2017_Power_Costs_2018.pdf">International Renewable Energy Agency (IRENA). (2017). Renewable Power Generation Costs in 2017. Retrieve From: https://www.irena.org/-/media/Files/IRENA/Agency/Publication/2018/Jan/IRENA_2017_Power_Costs_2018.pdf</ref>. |
<br/> | <br/> | ||
| Line 424: | Line 420: | ||
! scope="col" | Market & Costs' Development | ! scope="col" | Market & Costs' Development | ||
! scope="col" | Why? | ! scope="col" | Why? | ||
| − | ! scope="col" | Future | + | ! scope="col" | Future Projections |
|- | |- | ||
! scope="row" | Solar PV | ! scope="row" | Solar PV | ||
| Line 497: | Line 493: | ||
<br/> | <br/> | ||
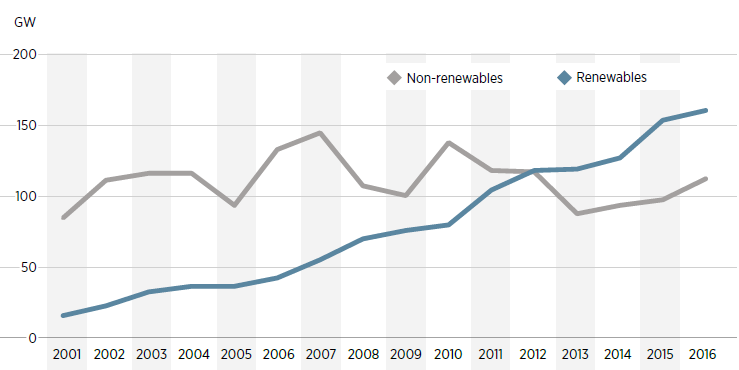
| − | [[File:Economics of RE 03- Renewables Vs. Non Renewables in Capacity Additions 2001-2016 (IRENA et al., 2018).PNG|thumb|center| | + | [[File:Economics of RE 03- Renewables Vs. Non Renewables in Capacity Additions 2001-2016 (IRENA et al., 2018).PNG|thumb|center|850px|Renewables Vs. Non Renewables in Global Capacity Additions 2001-2016 (IRENA et al., 2018)]] |
<br/> | <br/> | ||
| Line 537: | Line 533: | ||
<br/> | <br/> | ||
| − | [[File:Economics of RE 10- Experts' uncertain expectations regarding fossil fuels' cost development (REN21, 2017).PNG|thumb|center| | + | [[File:Economics of RE 10- Experts' uncertain expectations regarding fossil fuels' cost development (REN21, 2017).PNG|thumb|center|850px|Experts' uncertain expectations regarding fossil fuels' cost development (REN21, 2017)]] |
<br/> | <br/> | ||
| Line 549: | Line 545: | ||
<br/> | <br/> | ||
| − | [[File:Economics of RE 11- Experts' predictions regarding the continuity of renewables' costs fall (REN21, 2017).PNG|thumb|center| | + | [[File:Economics of RE 11- Experts' predictions regarding the continuity of renewables' costs fall (REN21, 2017).PNG|thumb|center|850px|Experts' predictions regarding the continuity of renewables' costs fall (REN21, 2017)]] |
<br/> | <br/> | ||
| − | [[File:Economics of RE 12- Experts predict investments in RE to continue rising through the coming decades till 2050 (REN21, 2017).PNG|thumb|center| | + | [[File:Economics of RE 12- Experts predict investments in RE to continue rising through the coming decades till 2050 (REN21, 2017).PNG|thumb|center|850px|Experts predict investments in RE to continue rising through the coming decades till 2050 (REN21, 2017)]] |
<br/> | <br/> | ||
Revision as of 14:58, 17 October 2018
► Back to Financing & Funding Portal
Overview
Renewable energy (RE) technologies' market is on the rise, and the world is witnessing a new energy transition with many factors and drivers pushing it.
To properly understand this phenomenon, it is vital to apprehend the correlation between the development of economies and the different energy transitions through history. It is also important to understand the rationale behind the current transition to renewables and their economy, This article presents and discusses both points.
The Energy Transition-Economic Development Correlation
The histories of energy transitions, development of economies and industrial civilizations, all go hand in hand[1][2]. Going back in time, people only needed to cover their basic needs, such as food, which -at the very beginning- was met by using firewood for cooking and heating[1][2]. Further in time, people started practicing agriculture in the first formed human communities, essentially depending on the sun for that practice, in combination with biomass[1][2].
As economies evolved and developed into complex forms, firewood and other biomass were no lonager able to meet the increasing demand in energy[1][2].So people started turning into hydropower, then to coal during the 19th century, oil and natural gas in the 20th, in addition to nuclear that was introduced in mid-20th century as well[1][2].
Therefore, it is apprehendable that each critical change in the economic system -along history- was always accompanied with a major energy transition -and vice versa-, shifting from one major energy source to another[1][2]. Currently, while fossil fuels (coal, oil and natural gas) are the dominant energy sources, the transition is already taking place from these sources into renewables (solar, wind, hydro... etc.)[1][2].
Though, the 21st century energy transition is going underway, not mainly because of change in human needs, but due to other factors as well[1][2]:
- Concerns about environmental impacts (degradation, greenhouse gas emissions GHG, climate change… etc.).
- The ongoing depletion of current energy sources, as they are limited and on the decline (millions of years to form, decades or less to consume).
- The continuous price and technological change of different energy sources and their technologies.
Considering the added costs to mitigate, adapt to or fight the environmental side effects of using fossil fuels, renewables might be the only option that people/societies/governments have to adopt, in order to reform the current economic system –at least in the energy sector- into a new one.
Challenges to Consider
Assuming that renewable energy sources will actually be able to take hold in the near future, then a few questions need to be argued and discussed beforehand: What renewable energy sources are available? How to determine an optimal renewable energy mix? How will optimum mixtures of renewable-energy sources differ based on location? How to determine and calculate the direct and external costs of renewable energy sources? How will the existing achievements of the renewable-energy sector affect the way energy is processed in current economy? What kind of changes in sectors as engineering, economy and policy would be needed to adapt to renewable energy sources?[2]
Scale is also an important issue. This is due to the fact that fossil-fuel technologies have been developed, improved and manufactured on an increasing scale for a century. This is not yet the case for renewables[3].
Economically, projections of energy sources’ prices and their technologies are vital for forecasting the economic options of the energy supply, also with few critical questions in mind: Should the choice of a technology be based on its current market price or because of its potential future cost reductions? Which technologies offer the most effective outcomes for specific applications? If the current technology is too expensive, should governmental subsidies help to achieve cost reduction for economic viability or is it better to wait for market forces –Smith’s invisible hands- to do the job?[4]
Rationale for Renewables
Reasons which have contributed to the acceleration of both public and private investment in renewable energy[2][5]:
- The growing demand for energy, which consequently requires a certain economic development.
- The fact that fossil fuels are finite, and negatively affecting the climate and polluting the air.
- The current critical environmental and climatic conditions, which drive the need to redirect energy technologies into more diverse, environmentally sustainable supply sources.
- The need to ensure future energy security.
- Mostly for developing countries in particular: Rapid urbanization, economic growth, uprising demographic trends and severe climate change conditions.
Utilizing renewables would help to avoid these problems, create new job opportunities and reduce the drain on hard currency for poorer countries. Because conventional fuels have received long-term subsidies in the past, it is vital that governments support the development of renewables in the form of financial incentives that can create a level playing field [6].
The future of the renewables industry depends on finance, risk-return profiles, business models, lifetime's investment and a sum of other economic, policy and social factors. Many new sources of finance are possible such as insurance funds, pension funds and sovereign wealth funds along with new mechanisms for financial risk mitigation. Many new business models are also possible for local energy services, utility services, transport, community and cooperative ownership, and rural energy services [7].
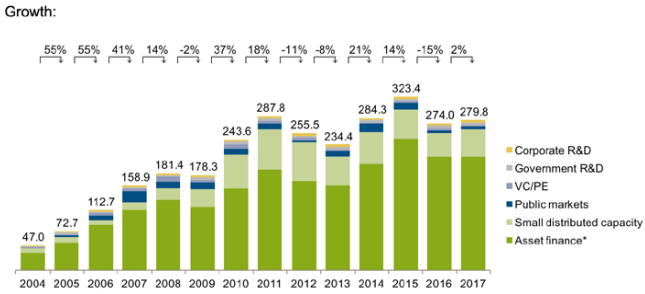
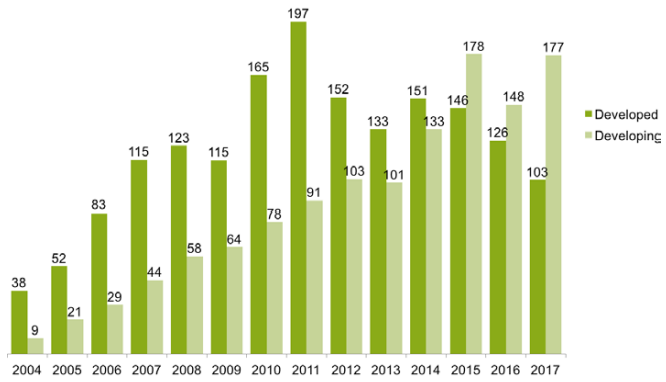
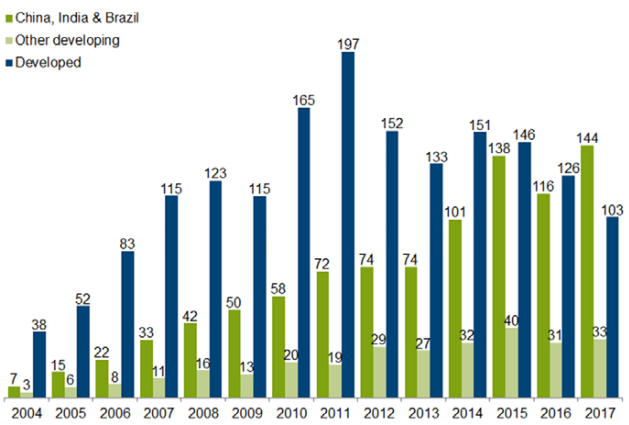
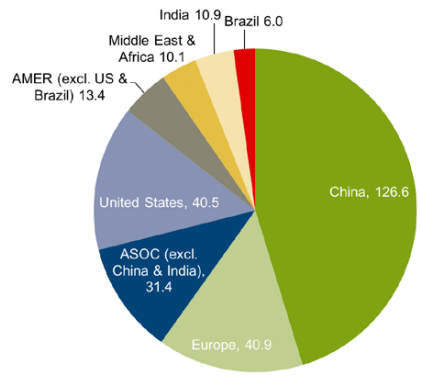
In 2011, the global investment in renewable power and fuels increased to a new record. Significantly, developing economies made up 35% of this total investment [8]. In addition, the whole period 2004-2017 has witnessed a remarkable increase in investments in renewables, either in different sectors, or for different technologies, in different countries with different economic systems, as illustrated in the following figures[9].
Renewable energy technologies (RETs) continue to face a number of barriers. However, the major challenge is mainly economic, as the issue of renewable energy technologies' costs is vital and central for the prediction of how rapidly the current energy transition will be taking place[2][5]. The costs include: infrastructure investment, day-to-day operations, market costs of supply and the environmental costs of the different energy sources[2][5].
Therefore, the debate remains mainly focused on the economic and financial perspectives, particularly on the cost-effectiveness of renewable energy technologies, and the possible various economic incentives to promote renewables globally in terms of: regulatory design and affordability[5].
Economic Rationale for Renewables
While by 2014 the world was getting about 80% of its electricity supplies from fossil fuels[2], that percentage has gone down 3.5-4% only within 3-4 years[5][10]. In 2017/18 fossil fuels contributed approximately 76.5% to the global electricity supply, reflecting the rise in the global renewables' market[5][10].
The cost advantage that fossil fuels used to have over renewable energy sources has been decreasing recently, with some renewable technologies (Solar PV, wind, hydropower) already competing fossil fuels directly on the financial frontier[2]. Furthermore, renewables' costs are expected to decline even further, and those of fossil fuels will incline[2]. The following two figures show that -while on one hand- the oil prices are on the rise during the 2000s, on the other hand, investments in renewables are on the rise during the same period, thus reflecting its competitiveness against oil in recent years.
The renewables' market development during the past 10-15 years had few moving factors, which can be summarized as follows:
- One outcome of the Kyoto Protocol, entering into force in early 2005, was the exponential growth of global investment in renewables[5].
- Rapid growth in energy demand for emerging economies, such as the cases of China & India, which are driven by transforming their energy industries[5][11].
- Uprising competition for energy sources[5].
- Inclining geopolitical tension[5].
- Energy security concerns[5].
- Increasing prices of oil and gas[5].
- Technological developments in the renewables' sector, and the emergence of more technology applications, especially generation of solar PV and wind power, which actually alone makes renewables more competitive, even without investment support[12][13].
- The need to commit to a long-term sustainable energy targets has further improved the climate for investments in renewables[13].
- Positive support of policy and law-makers in various countries, promoting scarcity of fossil fuels, their on-the-rise prices and climate challenges, which require adopting different energy approaches[13][14].
- Intensive research efforts, leading to improved system solutions with much higher efficiencies and lower production and operation costs[13].
The Market Situation
Costs of Renewables
According to the most recent reports on renewable energy technologies, from IRENA, REN21 and IEA, electricity costs from almost all the renewable projects that were commissioned in 2017, have continued to decline[11][15][4]. Projects of bioenergy power, hydropower, geothermal and onshore wind, which were commissioned in that year, have widely fallen into the generation costs' range of fossil-generated electricity, and furthermore, some of these projects have actually undercut those of fossil fuels-based ones[15].
The most common methodology for comparing different energy sources, is to calculate the Levelized Cost Of Energy (LCOE). LCOE measures lifetime costs, including building and operation of a power plant, divided by lifetime energy production/output[13][15][2].
As shown in the figure above, Global weighted LCOE of utility-scale solar PV has witnessed a remarkable drop (approximately 27%) since 2010, reaching USD 0.10/kWh for the new commissioned projects in 2017[15]. Under the right conditions, it will potentially decline to USD 0.03/kWh from 2018 onward[15].
Onshore wind is already one of the most competitive sources for generation capacity. Recent auctions in Brazil, Canada, Germany, India, Mexico and Morocco have resulted in LCOE as low as USD 0.03/kWh[15].
On the other hand, many auctions predict that by 2020, both Concentrated Solar Power (CSP) & offshore wind would have the potential to provide electricity with LCOE within the range of USD 0.06 - 0.10/kWh[15].
The varying fall ranges in LCOE for solar and wind power in particular have been mainly driven by the reduction in total installment costs, which is affected by three main forces[15]:
- Technology improvements.
- Competitive procurement and the rise of patents and innovators in the sector.
- The consequent emergence of a large base of experienced medium-to-large project developers, who are actively seeking new markets globally.
| % Drop in Installed Costs | Period | % Drop in LCOE | |
|---|---|---|---|
| Solar PV Modules | 68 | 2010-2017 | 73 |
| Concentrated Solar Thermal Projects | 27 | 2010-2017 | 33 |
| Onshore Wind Projects | 20 | 2010-2017 | 22 |
| Offshore Wind Projects | 2 | 2010-2017 | 13 |
Based on current installed projects and auction data, in combination with mass production increase and specific investment costs, electricity from renewables -sooner rather than later- will be cheaper than that from fossil fuels[13][15]. All the renewable power generation technologies are expected to fall within the fossil fuel cost range, with the majority having the potential to undercut it[13][15]. This will significantly lower the LCOE of all technologies, eventually leading to a market potential increase and development for renewables[13][15].
| 2008 | 2009 | 2010 | 2011 | 2012 | 2013 | 2014 | 2015 | 2016 | 2017 | |
|---|---|---|---|---|---|---|---|---|---|---|
| World | 1057962 | 1138759 | 1225714 | 1329346 | 1443834 | 1564607 | 1691997 | 1848739 | 2012430 | 2179099 |
| Africa | 23381 | 24986 | 26940 | 27319 | 28485 | 30639 | 32666 | 34511 | 38603 | 42139 |
| Asia | 311727 | 350065 | 387550 | 433754 | 478239 | 553680 | 629202 | 720667 | 812276 | 918655 |
| Central America & Caribbean | 7049 | 7299 | 7611 | 8418 | 9291 | 9605 | 10304 | 11972 | 13406 | 13801 |
| Eurasia | 66344 | 67753 | 69699 | 71495 | 76694 | 80880 | 84325 | 88149 | 91402 | 96326 |
| Europe | 273874 | 296492 | 322563 | 359975 | 394398 | 419127 | 440577 | 465369 | 488715 | 512348 |
| European Union | 217030 | 239487 | 265218 | 301797 | 334778 | 357654 | 378224 | 402253 | 423352 | 445496 |
| Middle East | 11910 | 12021 | 12852 | 13278 | 13940 | 14811 | 15668 | 16950 | 18021 | 18920 |
| North America | 207611 | 220419 | 232278 | 242967 | 264855 | 272103 | 284734 | 307325 | 331270 | 347635 |
| Oceania | 17172 | 17727 | 18406 | 19785 | 21389 | 22213 | 23828 | 24677 | 25640 | 27155 |
| South America | 138894 | 141997 | 147814 | 152355 | 156544 | 161548 | 170694 | 179119 | 193097 | 202120 |
Costs of Fossil Fuels
Costs relative to fossil fuels are also important particularly because:
1. Fossil-fuel energy does not reflect its full social costs.
- Climate change has been described as the "biggest market failure in history" (Stern Review, 2006) because the environmental costs associated with carbon emissions are not included in market prices.
- Furthermore, fossil fuels are subsidized for about US$300 billion per year. Removing theses subsidies and incorporating externalities into fossil fuel costs would dramatically change relative costs[3].
- Also the external costs which are related to the use of fossil fuels, stemming from different causes: pollution and environmental degradation as a consequence of extraction of resources, indoor and outdoor air pollution, resulting from direct fuel combustion, as well as non-combustion emissions (e.g. industrial processes)[17].
- Further side effects, which also could add to the externalities, as fossil fuels produce: Sulphur oxide SO2, mono-nitrogen oxides NOx, particular emissions PM2.5, ammonia NH3 and volatile organic compounds VOCs, which can cause: adverse human health effects, reducing agricultural yields, damaging forests, buildings, and infrastructure[17]
- Currently, the climate change and air pollution's external effects -alone- are approximately in the range of 2.2-5.9 trillion USD per year, while the all-in-all cost of the global energy supply is around 5 trillion USD per year[17]. The externalities of air pollution, caused by fossil fuels in Europe alone, were recorded ranging between 330 billion-940 billion USD in 2010[17].
2. It is more expensive to deliver non-renewable energy in some places than others.
- For example, rural or remote communities in developing countries are often not connected to the grid, resulting in "off-grid" energy production - particularly solar power - being more competitive than extending the grid[3].
3. Fossil Fuels are fast depleting and scarcer than RE
- Fossil fuels are finite, as upon being consumed long enough, global resources will eventually run out[18].
- For a proper estimate of how long can current fossil fuel reserves be consumed for, the following figure (Fig,16), has been plotted by dividing the quantity of known fuel reserves by the current rate of production (Reserves-to-Production R/P)[18].
Market Competition - Renewables V.s. Fossil Fuels
As the markets develop, the costs normally do as well, as both developments go hand in hand[4][2]. The previously mentioned factors push the market to increase its renewables' volume, leading to economies of scale. On one hand, this reduces the price and later the actual costs of the technology, while on the other hand, reduced prices increase market volumes, again producing economies of scale, eventually resulting in a feedback loop, that either way paves the path for renewables[4][15].
The continuous pressure on market prices and its margins is rapidly forcing the market to change, as renewables' costs have considerably declined and are still on the decline[4]. Their costs are expected to go down even further over the coming few years[10][4]. Furthermore, adding to renewables' economic evolution, both public commitments and the maturing technologies, investments in renewables have rapidly increased turning the renewables industry to a very competitive sector against other energy resources[4]. However, the competition is not only limited within the energy or power sector itself, but different renewables are even starting to compete against each other within the renewables' sector itself[10][4].
| Technology | Market & Costs' Development | Why? | Future Projections |
|---|---|---|---|
| Solar PV |
|
|
|
| Wind Power |
|
|
|
| Concentrated Solar Power (CSP) & Solar Thermal Energy (STE) |
|
||
| Hydropower |
|
|
|
| Biomass Power |
|
|
With costs of renewables are continuing to fall, drastically in solar PV, followed by wind and concentrated solar power closely behind, the global installed capacity has exponentially grown, as a world record amount of recently installed renewables' (especially solar PV, wind, CSP & hydro) capacity has been added in the past few years, adding up to almost two thirds of the all new generating capacity installed globally in 2016[10][4].
Renewables' power capacity investments have by far surpassed those of fossil fuels in the year 2017, thus being catalyzed by increasing innovation, competition and policy support, achieving radical technological advances and sharp cost reduction in renewables' sector, pushing them to outpace any other technology source[10].
Economically Accelerating The Energy Transition to Renewables
Though, the renewables market is inclining, and all indicators show that it will continue on the rise for the coming decades, yet most of the recent reports suggest that it would still not be enough to meet the global goals by 2030, therefore, in the follwoing, there are some strategies that can push and encourage investment in the sector.
Expansion of Renewable Energy Use:
- The basic economics of renewable energy need to be artificially altered, either by increasing the cost of fossil fuel-based energy (e.g. through taxes or equivalent mechanisms), or by reducing the costs of renewable energy (e.g. subsidies), or by boosting the returns to renewable energies (e.g. through paying a premium for this form of energy) [3].
- Developing countries should not necessarily be required to meet these costs. This is particularly so where the development of renewable energy capacity may place countries at a competitive disadvantage and/or these countries bear no responsibility for climate change. The costs should be met by countries that do bear these responsibilities. This case is even stronger while developed countries are subsidizing fossil-fuel energy[3].
Also, there exist three pillars on which this process of speeding up the energy transition can be built upon:
- Rising fossil fuel costs, which as shown is already on pathways, but can also be stimulated by creating new policies, or upgrading the existing ones, to remove or gradulally reduce current governmental fossil fuel subsidies in many countries, which, for an example, is being currently carried out in Egypt[2][19].
- Declining renewables' costs, which is also already taking place[2][15].
- Implementing new renewables' financial policies[2][10].
The following points provide a set of requirements and recommendations for a successful and more efficient cost reduction policies for renewables[5]:
- Encouraging Domestic manufacturing of renewables' equipment: the example of the Chinese case would be the best to illustrate this point, since the Chiese low-cost equipment have achieved a lot for the promotion of affordable renewable projects around Asia[5]. In Vietnam, hyrdro and wind turbine generators, which were manufactured in China, cost 60% of the same equipment manufactured in Europe
- Reducing institutional barriers: As experience has shown that institutional dysfunction always leads to delays, consequently having a major impact on the economic value of the projects in hands.
- Grounding renewables in the economic analysis and applying market principles.
- Enhancing transmission grids and supporting transmission integration.
Future Speculations of Fossil Fuels & Renewables' Costs
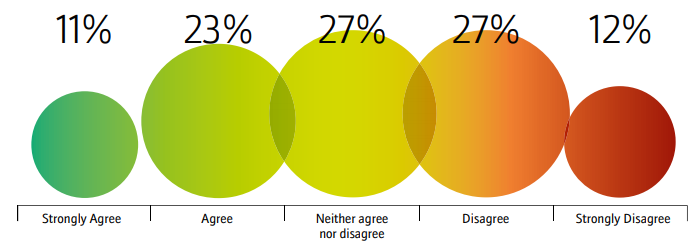
A survey conducted by REN21 in their 2017's Renewables Global Future Report, resulted in a noticeable uncertainty regarding future projections of fossil fuels costs' development, as one third of the participating experts expected a rise from the 2015's recorded average of USD 52, to over USD 1000 in the near future while the second third completely disagreed with the first, and the final third remaind uncertain and neutral with both opinions[4].
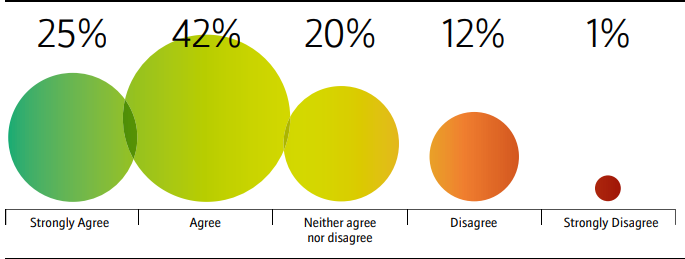
On the other hand, with the current market changes in the energy sector, and the remarkable technological achievements, especially for solar PV and wind technologies, the estimates of future renewables equipment cost were found to be more predictable, less risky with a significantly higher certainty than fossil fuels, as about 3/4 of the survey participants agreed that renewables' costs will continue to fall and in more accelerated fashion than that of fossil fuels[4].
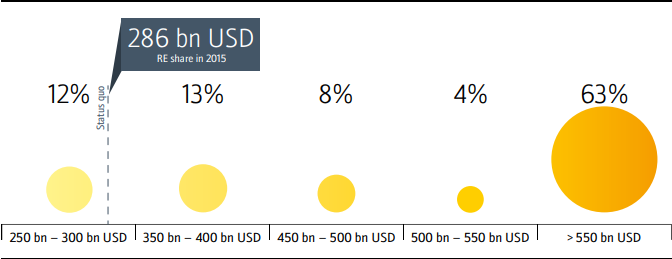
Furthermore, the majority of the survey participants believed that the investments in renewables will continue rising along the coming decades, at least til 2050[4].
Further Information
- Assessing the Economic Viability of Business Ideas for Productive Use
- Economic and Financial Impacts of Grid Interconnections
- Economic Viability of a Biogas Plant
- Economic Analyses of Wind Energy Projects
- Macro-economic evaluation of Biogas Plants
- Socio-economic and Environmental Impacts of MHP
- Subsidies
References
- ↑ 1.0 1.1 1.2 1.3 1.4 1.5 1.6 1.7 Bridge, G. Bouzarovski, S. Bradshaw, M. & Eyre, N. (2013). Geographies of energy transition: space, place and the low-carbon economy. Energy Policy 53: 331-340. URL: http://www.sciencedirect.com/science/article/pii/S0301421512009512
- ↑ 2.00 2.01 2.02 2.03 2.04 2.05 2.06 2.07 2.08 2.09 2.10 2.11 2.12 2.13 2.14 2.15 2.16 2.17 2.18 2.19 Timmons, D. Harris, J. M. & Roach, B. (2014). The Economics of Renewable Energy. Retrieved From: https://ase.tufts.edu/gdae/education_materials/modules/RenewableEnergyEcon.pdf
- ↑ 3.0 3.1 3.2 3.3 3.4 Griffith-Jones, S., Ocampo, J. A. & Spratt, S., 2011. Financing Renewable Energy in Developing Countries: Mechanisms and Responsibilities. Available at: http://erd-report.eu/erd/report_2011/documents/dev-11-001-11researchpapers_griffith-jones-ocampo-spratt.pdf Cite error: Invalid
<ref>tag; name "Griffith-Jones, S., Ocampo, J. A. & Spratt, S., 2011. Financing Renewable Energy in Developing Countries: Mechanisms and Responsibilities. Available at: http://erd-report.eu/erd/report_2011/documents/dev-11-001-11researchpapers_griffith-jones-ocampo-spratt.pdf" defined multiple times with different content - ↑ 4.00 4.01 4.02 4.03 4.04 4.05 4.06 4.07 4.08 4.09 4.10 4.11 4.12 REN21. (2017). Renewables Global Futures Report: Great Debates towards 100% Renewable Energy. Retrieved From: http://www.ren21.net/wp-content/uploads/2017/10/GFR-Full-Report-2017_webversion_3.pdf
- ↑ 5.00 5.01 5.02 5.03 5.04 5.05 5.06 5.07 5.08 5.09 5.10 5.11 5.12 5.13 Meier, P. Vagliasindi, M. Imran, M. Eberhard, A. & Siyambalapitiya, T. (2015). The Design and Sustainability of Renewable Energy Incentives: An Economic Analysis. Retrieved From: https://openknowledge.worldbank.org/bitstream/handle/10986/20524/922240PUB0978100Box385358B00PUBLIC0.pdf?sequence=1
- ↑ United Nations Environment Programme Finance Initiative (UNEP FI), 2004. CEO briefing - Renewable Energy, Geneva, Switzerland: United Nations Environment Programme Finance Initiative (UNEP FI).
- ↑ Appleyard, D., March 2013. The Future of Renewables: Economic, Policy and Social Impications - Renewable Energy World International. Available at: http://www.renewableenergyworld.com/rea/news/article/2013/03/from-the-editor20
- ↑ Frankfurt School UNEP Collaborating Centre for Climate & Sustainable Energy Finance, 2012. Global Trends in Renewable Energy Investment 2012, Frankfurt am Main, Germany: Frankfurt School UNEP Collaborating Centre for Climate & Sustainable Energy Finance.
- ↑ Frankfurt School & United Nations Environment Programme (FS-UNEP Collaborating Centre). (2018). Global Trends in Renewable Energy Investment 2018. Retrieved From: https://europa.eu/capacity4dev/search?text=Renewable%20energy%20investment
- ↑ 10.0 10.1 10.2 10.3 10.4 10.5 10.6 International Renewable Energy Agency (IRENA). International Energy Agency (IEA). & Renewable Energy Policy Network for the 21st Century (REN21). (2018). Renewable Energy Policies in a Time of Transition. Retrieved From: http://www.ren21.net/wp-content/uploads/2018/04/17-8622_Policy_FullReport_web_.pdf
- ↑ 11.0 11.1 International Renewable Energy Agency (IRENA), International Energy Agency (IEA) & Renewable Energy Policy Network for the 21st Century (REN21). (2018). Renewable Energy Policies in a Time of Transition. Retrieved From: http://www.irena.org/-/media/Files/IRENA/Agency/Publication/2018/Apr/IRENA_IEA_REN21_Policies_2018.pdf
- ↑ Yamamoto, Y. (2018). Feed-in Tariffs and the Economics of Renewable Energy. Retrieved From: https://www.springer.com/de/book/9783319768632
- ↑ 13.0 13.1 13.2 13.3 13.4 13.5 13.6 13.7 13.8 Fraunhofer ISE. (2018). Levelized Cost of Electricity Renewable Energy Technologies. Retrieved From: https://www.ise.fraunhofer.de/content/dam/ise/en/documents/publications/studies/EN2018_Fraunhofer-ISE_LCOE_Renewable_Energy_Technologies.pdf
- ↑ https://ourworldindata.org/how-long-before-we-run-out-of-fossil-fuels
- ↑ 15.00 15.01 15.02 15.03 15.04 15.05 15.06 15.07 15.08 15.09 15.10 15.11 15.12 15.13 15.14 International Renewable Energy Agency (IRENA). (2017). Renewable Power Generation Costs in 2017. Retrieve From: https://www.irena.org/-/media/Files/IRENA/Agency/Publication/2018/Jan/IRENA_2017_Power_Costs_2018.pdf
- ↑ International Renewable Energy Agency (IRENA). (2018). Renewable Capacity Statistics. Retrieved From: https://www.irena.org/-/media/Files/IRENA/Agency/Publication/2018/Mar/IRENA_RE_Capacity_Statistics_2018.pdf
- ↑ 17.0 17.1 17.2 17.3 Markandya, A. Saygin, D. Miketa, A. Gielen, D. & Wagner, N. (2016). The True Cost of Fossil Fuels: Saving on the Externalities of Air Pollution and Climate Change. Retrieved From: https://www.irena.org/-/media/Files/IRENA/Agency/Publication/2016/IRENA_REmap_externality_brief_2016.pdf
- ↑ 18.0 18.1 Ritchie, H. (2017). How Long Before We Run Out of Fossil Fuels?. Retrieved From: https://ourworldindata.org/how-long-before-we-run-out-of-fossil-fuels
- ↑ Hegazy, K. (2015). Energy Charter Secretariat Knowledge Centre’s Occasional Paper on Egypt’s Energy Sector: Regional Cooperation Outlook and Prospects of Furthering Engagement with The Energy Charter. Retrieved From: https://energycharter.org/fileadmin/DocumentsMedia/Occasional/Egypt_and_the_Charter.pdf

