Total Energy Wiki
Welcome to the Total Energy Wiki!
|
{{#icon:Practical-action-logo-highres-300dpi.jpg | http://practicalaction.org}} |
What is this about?
Current energy access data collection is driven by national governments and international organisations such as the International Energy Agency and International Monetary Fund. This effects the way energy access is defined, as indicators are largely based upon supply-side factors, such as the number of grid electricity connections, regardless of whether people are actually able to use them. International development and technology charity Practical Action has set up this Total Energy Wiki as an online data collection system enabling people and organisations to participate in and contribute to collecting data on energy access in a different way. It is intended to be a grassroots, crowd-sourced way of collecting data which could complement existing data collection systems, and provide a broader picture of how energy services are made available to and used by poor people.
Total Energy Access and Energy Supply Index
In the Poor people’s energy outlook report 2010 (PPEO), Practical Action proposed a set of indicators for measuring household energy access; Total Energy Access (TEA) and the Energy Supply Index (ESI). TEA is defined by a set of minimum standards for five key energy services at point of use, and the ESI defines the supply-side quality of the energy.
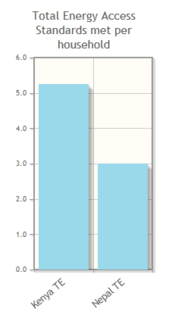
The latest edition of the Poor people’s energy outlook report 2012 has updated these indicators after consultation with many practitioners. These are outlined below. The PPEO 2012 also trialled these indicators in six communities across Kenya, Nepal and Peru, using this questionnaire.
Using the Wiki
Practical Action has set up the Total Energy Wiki to encourage energy practitioners, development workers, community- and non-governmental organisations to use the same questionnaire to record information about local energy access. The results of this questionnaire can be uploaded to this site either through an Excel spreadsheet, or an online web form- both options are on the right of this page.
By sharing this Wiki with as many people as possible we hope to gather data sets that can be compared across communities, countries and regions, helping the whole energy community work towards prioritising energy access where there are obvious gaps and shortfalls.
The Total Energy Access Minimum Standards for a household are:
| Energy service |
Minimum standard | |
|---|---|---|
| Lighting |
1.1 |
300 lm for a minimum of 4 hours per night at household level |
| Cooking and water heating |
2.1 |
1 kg woodfuel or 0.3 kg charcoal or 0.04 kg LPG or 0.2 litres of kerosene or ethanol per person per day, taking less than 30 minutes per household per day to obtain |
| 2.2 |
Minimum efficiency of improved solid fuel stoves to be 40% greater than a three-stone fire in terms of fuel use | |
| 2.3 |
Annual mean concentrations of particulate matter (PM2.5) < 10 μg/m3 in households, with interim goals of 15 μg/m3, 25 μg/m3 and 35 μg/m3 | |
| Space heating |
3.1 |
Minimum daytime indoor air temperature of 18ºC |
| Cooling |
4.1 |
Households can extend life of perishable products by a minimum of 50% over that allowed by ambient storage |
| 4.2 |
Maximum apparent indoor air temperature of 30 C | |
| Information and communications |
5.1 |
People can communicate electronic information from their household |
| 5.2 |
People can access electronic media relevant to their lives and livelihoods in their household |
Total Energy Access if fulfilled by a household that meets all nine minimum standards.
The Energy Supply Index is defined by the following levels:
| Energy Supply |
Level |
Qualtiy of Supply |
|---|---|---|
| Household fuels |
0 |
Using non-standard solid fuels such as plastics |
| 1 |
Using solid fuel in an open/three-stone fire | |
| 2 |
Using solid fuel in an improved stove | |
| 3 |
Using solid fuel in an improved stove with smoke extraction/chimney | |
| 4 |
Mainly using a liquid or gas fuel or electricity, and associated stove | |
| 5 |
Using only a liquid or gas fuel or electricity, and associated stove | |
| Electricity |
0 |
No access to electricity at all |
| 1 |
Access to third party battery charging only | |
| 2 |
Access to stand-alone electrical appliance (eg solar lantern, solar phone charger) | |
| 3 |
Own limited power access for multiple home applications (eg Solar home systems or power-limited off-grid) | |
| 4 |
Poor quality and/or intermittent AC connection (remove 240V as non-standard) | |
| 5 |
Reliable AC connection available for all uses (remove 240V as non-standard) | |
| Mechanical Power |
0 |
No household access to tools or mechanical advantages |
| 1 |
Hand tools available for household tasks | |
| 2 |
Mechanical advantage devices available to magnify human/animal effort for most household tasks | |
| 3 |
Powered mechanical devices available for some household tasks | |
| 4 |
Powered mechanical devices available for most household tasks | |
| 5 |
Mainly purchasing mechanically processed goods and services |


