File:Simulated VRE Output and Residual Load in Taiwan by summer 2025 (Low Carbon Scenario).png
From energypedia
Size of this preview: 800 × 230 pixels. Other resolutions: 320 × 92 pixels | 1,686 × 485 pixels.
Original file (1,686 × 485 pixels, file size: 0 bytes, MIME type: image/png)
Summary
| Description |
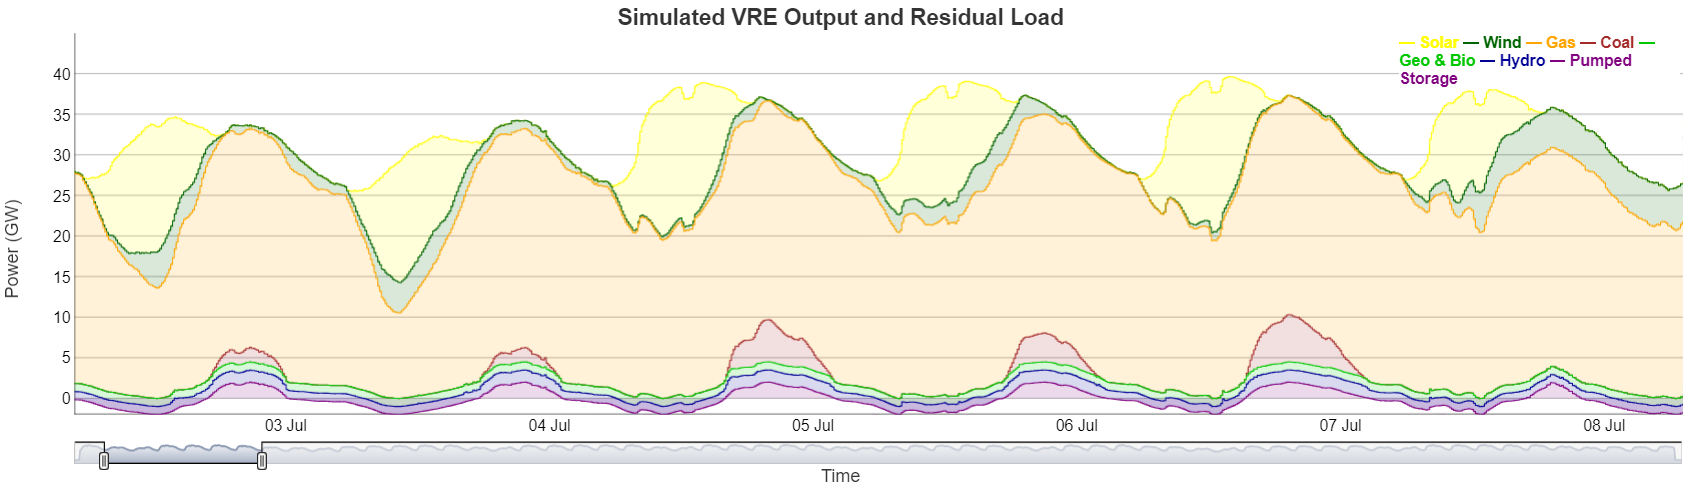
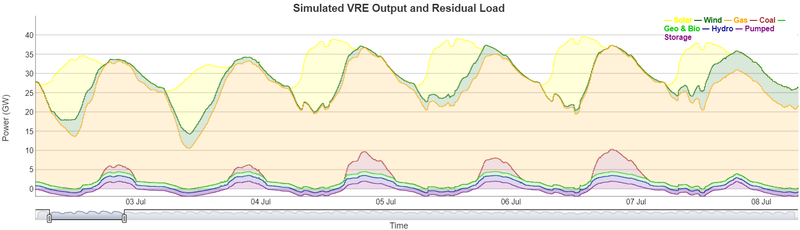
English: This is a simulated power output profile in Taiwan by summer 2025. Since most renewable capacity by then will be solar, you can see the duck curve quite easily. The hard coal power plants were modeled with full account of their flexibility potentials under this scenario, and they are used only when the residual load is above a threshold capacity.
|
|---|---|
| Source |
Own Work |
| Date |
2018-01-24 |
| Author | |
| Permission |
See license tag below. |
Licensing
|
File history
Click on a date/time to view the file as it appeared at that time.
| Date/Time | Thumbnail | Dimensions | User | Comment | |
|---|---|---|---|---|---|
| current | 12:51, 28 January 2018 | 1,686 × 485 (0 bytes) | ***** (***** | *****) | User created page with UploadWizard |
You cannot overwrite this file.
File usage
The following page uses this file:


.png&oldid=243879)
.png)
.png&action=edit&redlink=1)
.png&action=edit)
.png&action=history)
.png)
.png)
.png&oldid=243879)
.png&action=info)
.png)