Knowledge fuels change - Support energypedia!
For over 10 years, energypedia has been connecting energy experts around the world — helping them share knowledge, learn from each other, and accelerate the global energy transition.
Today, we ask for your support to keep this platform free and accessible to all.
Even a small contribution makes a big difference! If just 10–20% of our 60,000+ monthly visitors donated the equivalent of a cup of coffee — €5 — Energypedia would be fully funded for a whole year.
Is the knowledge you’ve gained through Energypedia this year worth €5 or more?
Your donation keeps the platform running, helps us create new knowledge products, and contributes directly to achieving SDG 7.
Thank you for your support, your donation, big or small, truly matters!
Difference between revisions of "Togo Energy Situation"
***** (***** | *****) |
***** (***** | *****) |
||
| Line 83: | Line 83: | ||
The total energy consumption of 22.943 GWh is divided into 4% electrical energy, 20% petroleum products and 76% biomass. A large part of this energy is consumed in households (73.5%), followed by the transport sector (13.2%) and the market sector (10.1%). Industry consumes a share of 3%. Households use mainly wood as a direct form of energy (56.9%) but also charcoal (33.7%). Electricity is used as a form of energy in 3.6% of households. In the transport sector, a lot of petrol (46%) and diesel (35%) is used. In industry, there is an even distribution in the consumption of electricity (36%), diesel (37%) and fuel oil (27%). (SIE, 2017) | The total energy consumption of 22.943 GWh is divided into 4% electrical energy, 20% petroleum products and 76% biomass. A large part of this energy is consumed in households (73.5%), followed by the transport sector (13.2%) and the market sector (10.1%). Industry consumes a share of 3%. Households use mainly wood as a direct form of energy (56.9%) but also charcoal (33.7%). Electricity is used as a form of energy in 3.6% of households. In the transport sector, a lot of petrol (46%) and diesel (35%) is used. In industry, there is an even distribution in the consumption of electricity (36%), diesel (37%) and fuel oil (27%). (SIE, 2017) | ||
| + | |||
| Line 97: | Line 98: | ||
In recent years, progress has been made in the electrification of the country's major cities. However, great efforts are also being made for rural electrification, but it still represents a major challenge. A total of 4 million inhabitants in Togo still must be supplied with electricity. | In recent years, progress has been made in the electrification of the country's major cities. However, great efforts are also being made for rural electrification, but it still represents a major challenge. A total of 4 million inhabitants in Togo still must be supplied with electricity. | ||
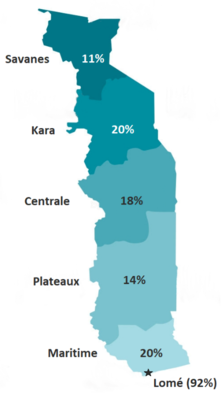
| − | [[File:Figure 7.1 Togo energy sector.png|thumb|center| | + | [[File:Figure 7.1 Togo energy sector.png|thumb|center|222px|Togo energy sector indicators. On the left: The electricity access rate per region. On the right: Key energy sector indicators. (Global Lightning, 2018)]] |
Currently, an electrical power of 230,000 kW is produced in the country. It is estimated that in 2030 a total of 100,800,000kW of electricity will have to be produced to supply the entire population with electricity. (PERC, 2015) (Global Lightning, 2018) | Currently, an electrical power of 230,000 kW is produced in the country. It is estimated that in 2030 a total of 100,800,000kW of electricity will have to be produced to supply the entire population with electricity. (PERC, 2015) (Global Lightning, 2018) | ||
The National Electrification Strategy was developed to realize this (see chapter 6). With this project, the government of Togo has set itself the goal of expanding renewable energy in particular and implementing various new strategies to provide universal access to electricity. The focus is on the expansion of solar energy for the electrification of rural areas. In addition, new opportunities for hydropower are to be developed. This technology has so far only been used in large-scale projects. In the future, however, smaller plants are also to be implemented. (CIA, 2016) (Worldbank, 2017) (SET, 2018)<br/> | The National Electrification Strategy was developed to realize this (see chapter 6). With this project, the government of Togo has set itself the goal of expanding renewable energy in particular and implementing various new strategies to provide universal access to electricity. The focus is on the expansion of solar energy for the electrification of rural areas. In addition, new opportunities for hydropower are to be developed. This technology has so far only been used in large-scale projects. In the future, however, smaller plants are also to be implemented. (CIA, 2016) (Worldbank, 2017) (SET, 2018)<br/> | ||
| + | <div>'''Table 1 Overview of the energy sector in Togo. The data was compiled from various sources and provides information on the current electrification rate, electricity production and consumption. The table also shows the electricity production costs compared to the electricity price and the different types of electricity production.'''<br/></div> | ||
| + | {| style="width: 737px" cellspacing="0" cellpadding="0" border="1" align="left" | ||
| + | |- | ||
| + | | colspan="2" style="width: 730px" | | ||
| + | ''' Electricity – Overview:''' | ||
| + | |||
| + | |- | ||
| + | | style="width:350px" | | ||
| + | '''Electricity Access Rates (AT2ER, 2018)'''<br/> | ||
| + | |||
| + | | style="width: 376px" | | ||
| + | {| cellspacing="0" cellpadding="0" border="0" | ||
| + | |- | ||
| + | | style="width:100px" | | ||
| + | National: | ||
| + | |||
| + | | style="width:137px" | | ||
| + | 45%<br/> | ||
| + | |||
| + | |- | ||
| + | | style="width:100px" | | ||
| + | Rural: | ||
| + | |||
| + | | style="width:137px" | | ||
| + | 8%<br/> | ||
| + | |||
| + | |} | ||
| + | |||
| + | |- | ||
| + | | style="width:350px" | | ||
| + | '''Population without electricity (AT2ER, 2018)''' | ||
| + | |||
| + | | style="width: 376px" | | ||
| + | {| cellspacing="0" cellpadding="0" border="0" align="left" | ||
| + | |- | ||
| + | | style="width:125px" | | ||
| + | | ||
| + | |||
| + | | style="width:161px" | | ||
| + | 4 million | ||
| + | |||
| + | |} | ||
| + | |||
| + | |||
| + | |||
| + | |- | ||
| + | | style="width:350px" | | ||
| + | '''Installed capacity (cumulated, 2020)''' | ||
| + | |||
| + | | style="width: 376px" | | ||
| + | {| cellspacing="0" cellpadding="0" border="0" align="left" | ||
| + | |- | ||
| + | | style="width:125px" | | ||
| + | | ||
| + | |||
| + | | style="width:161px" | | ||
| + | 262 MW | ||
| + | |||
| + | |} | ||
| + | |||
| + | |||
| + | |||
| + | |- | ||
| + | | style="width:350px" | | ||
| + | '''Required capacity for 100% electrification (est. in 2030) (SET, 2018)''' | ||
| + | |||
| + | | style="width: 376px" | | ||
| + | {| cellspacing="0" cellpadding="0" border="0" align="left" | ||
| + | |- | ||
| + | | style="width:125px" | | ||
| + | | ||
| + | |||
| + | | style="width:161px" | | ||
| + | 100,800 MW | ||
| + | |||
| + | |} | ||
| + | |||
| + | |||
| + | |||
| + | |- | ||
| + | | style="width:350px" | | ||
| + | '''Electricity – production (SIE, 2017)''' | ||
| + | |||
| + | | style="width: 376px" | | ||
| + | {| cellspacing="0" cellpadding="0" border="0" align="left" | ||
| + | |- | ||
| + | | style="width:125px" | | ||
| + | | ||
| + | |||
| + | | style="width:161px" | | ||
| + | 418 GWh | ||
| + | |||
| + | |} | ||
| + | |||
| + | |||
| + | |||
| + | |- | ||
| + | | style="width:350px" | | ||
| + | '''Electricity – consumption (SIE, 2017)''' | ||
| + | |||
| + | | style="width: 376px" | | ||
| + | {| cellspacing="0" cellpadding="0" border="0" align="left" | ||
| + | |- | ||
| + | | style="width:66px" | | ||
| + | | ||
| + | |||
| + | | style="width:219px" | | ||
| + | 976 GWh | ||
| + | |||
| + | |} | ||
| + | |||
| + | |||
| + | |||
| + | |- | ||
| + | | style="width:350px" | | ||
| + | '''Electricity – imports (SIE, 2017)''' | ||
| + | |||
| + | | style="width: 376px" | | ||
| + | {| cellspacing="0" cellpadding="0" border="0" align="left" | ||
| + | |- | ||
| + | | style="width:66px" | | ||
| + | | ||
| + | |||
| + | | style="width:219px" | | ||
| + | 744 GWh | ||
| + | |||
| + | |} | ||
| + | |||
| + | |||
| + | |||
| + | |- | ||
| + | | style="width:350px" | | ||
| + | '''Average cost of service (Global Lightning, 2018)''' | ||
| + | |||
| + | | style="width: 376px" | | ||
| + | {| cellspacing="0" cellpadding="0" border="0" | ||
| + | |- | ||
| + | | style="width:125px" | | ||
| + | | ||
| + | |||
| + | | style="width:161px" | | ||
| + | US$ 0.29 per kWh | ||
| + | |||
| + | |} | ||
| + | |||
| + | |||
| + | |||
| + | |- | ||
| + | | style="width:350px" | | ||
| + | '''Average tariff (2016) (Global Lightning, 2018)''' | ||
| + | |||
| + | | style="width: 376px" | | ||
| + | {| cellspacing="0" cellpadding="0" border="0" | ||
| + | |- | ||
| + | | style="width:125px" | | ||
| + | | ||
| + | |||
| + | | style="width:161px" | | ||
| + | US$ 0.19 per kWh | ||
| + | |||
| + | |} | ||
| + | |||
| + | |||
| + | |||
| + | |- | ||
| + | | style="width:350px" | | ||
| + | '''Sources of electricity production (Worldbank, 2017)''' | ||
| + | |||
| + | | style="width: 376px" | | ||
| + | {| cellspacing="0" cellpadding="0" border="0" | ||
| + | |- | ||
| + | | style="width:181px; height:22px" | | ||
| + | Petroleum products: | ||
| + | |||
| + | | style="width:98px; height:22px" | | ||
| + | 24.7% | ||
| + | |||
| + | |- | ||
| + | | style="width:181px; height:11px" | | ||
| + | Hydropower: | ||
| + | |||
| + | | style="width:98px; height:11px" | | ||
| + | 69.1% | ||
| + | |||
| + | |- | ||
| + | | style="width:181px; height:21px" | | ||
| + | Renewable sources: | ||
| + | |||
| + | | style="width:98px; height:21px" | | ||
| + | 6.2% | ||
| + | |||
| + | |} | ||
| + | |||
| + | |||
| + | |||
| + | |- | ||
| + | | style="width:350px" | | ||
| + | '''CEET Electricity bill collection rate (CEET, 2019)''' | ||
| + | |||
| + | | style="width: 376px" | | ||
| + | {| style="width: 287px" cellspacing="0" cellpadding="0" border="0" | ||
| + | |- | ||
| + | | style="width: 180px; height: 22px" | | ||
| + | Residential and industrial customers: | ||
| + | |||
| + | | style="width: 98px; height: 22px" | | ||
| + | | ||
| + | |||
| + | 83% | ||
| + | |||
| + | |- | ||
| + | | style="width: 180px; height: 11px" | | ||
| + | Public sector customer: | ||
| + | |||
| + | | style="width: 98px; height: 11px" | | ||
| + | | ||
| + | |||
| + | 17% | ||
| + | |||
| + | |} | ||
| + | |||
| + | |||
| + | |||
| + | |} | ||
| + | |||
| + | <br/> | ||
Revision as of 10:56, 28 May 2020
Capital:
Lomé
Region:
Coordinates:
6.7° N, 1.13° E
Total Area (km²): It includes a country's total area, including areas under inland bodies of water and some coastal waterways.
XML error: Mismatched tag at line 6.
Population: It is based on the de facto definition of population, which counts all residents regardless of legal status or citizenship--except for refugees not permanently settled in the country of asylum, who are generally considered part of the population of their country of origin.
XML error: Mismatched tag at line 6. ()
Rural Population (% of total population): It refers to people living in rural areas as defined by national statistical offices. It is calculated as the difference between total population and urban population.
XML error: Mismatched tag at line 6. ()
GDP (current US$): It is the sum of gross value added by all resident producers in the economy plus any product taxes and minus any subsidies not included in the value of the products. It is calculated without making deductions for depreciation of fabricated assets or for depletion and degradation of natural resources.
XML error: Mismatched tag at line 6.2 ()
GDP Per Capita (current US$): It is gross domestic product divided by midyear population
XML error: Mismatched tag at line 6. ()
Access to Electricity (% of population): It is the percentage of population with access to electricity.
XML error: Mismatched tag at line 6.no data
Energy Imports Net (% of energy use): It is estimated as energy use less production, both measured in oil equivalents. A negative value indicates that the country is a net exporter. Energy use refers to use of primary energy before transformation to other end-use fuels, which is equal to indigenous production plus imports and stock changes, minus exports and fuels supplied to ships and aircraft engaged in international transport.
XML error: Mismatched tag at line 6.no data
Fossil Fuel Energy Consumption (% of total): It comprises coal, oil, petroleum, and natural gas products.
XML error: Mismatched tag at line 6.no data
Introduction
Geographie
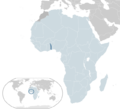
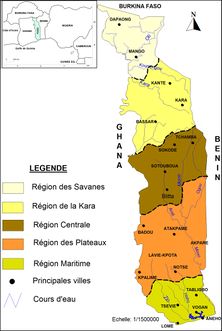
Togo is a state in West Africa, located on the Gulf of Guinea. It borders Burkina Faso to the north, Benin to the east, Ghana to the west and the Atlantic Ocean to the south. The country covers almost 57.000 km². The plains in the north and south are dominated by savannah land, which makes up about 23% of the country's total area. About 16 % of the country is covered by tropical rainforests and savannah forests, about 33 % is used as meadow or grassland and about a quarter is used as agricultural land, especially for coffee, tea, cocoa, cotton, coconut and peanuts, cassava, rice, millet and corn. The country is divided into the regions Maritime, Plateaux, Central, Kara, Savanes. (Togo, 2020)
The longest river is the Mono with 467 km length. It runs from north to south and can be used as a waterway for 50 km. The river is also used for energy production with a large hydroelectric power plant, at the Nangbeto Dam. The reservoir near Atakampé dams the river Mono. The lake is used for irrigation for agriculture and for electricity production. (Worldbank, 2017)
Climate
The climate is tropical humid all year round, with average temperatures of 30°C in the north and 27°C on the coast in the south. There is only a slight cooling at night. Due to the elongated shape of the country, there are different climatic conditions in the north and south of the country. The North is strongly influenced by the continental climate. The rainy season takes place there from May to October. August is the coolest month, January the driest. Located on the coast, the south, is strongly influenced by the maritime climate. There are two rainy seasons from April to June and from September to November. The driest month is December, the coolest month is August. (DWD, 2020)
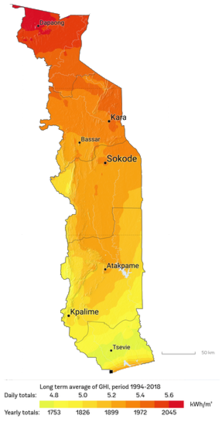
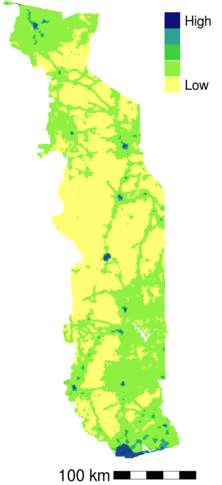
The high and over the year relatively constant solar radiation results in a high value of available solar energy. By means of satellite data of the solar energy per day and per year it can be estimated which region is particularly suitable to produce solar energy. The solar irradiation increases from south to north. In the dry regions in the very north of the country, the solar irradiation reaches its maximum with a value of 2045 kWh/m² per year. (Global Solar, 2019)
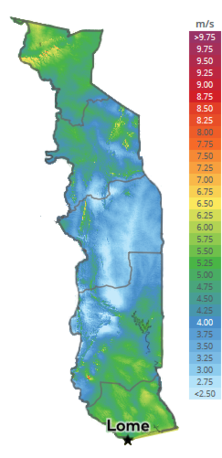
According to the data of the Global Wind Atlas, Togo is located in an area with very low winds. On the coast in the south, wind speeds are on average higher than in the interior. Furthermore, there are greater amounts of wind speeds in higher and mountainous areas. (Global Wind, 2019)
People and Society
Togo is one of the most densely populated countries in Africa, with most of the population living in rural communities, with the highest density in the south near the Atlantic coast. The distribution of the population is very uneven due to variations in soil and terrain. The population is generally concentrated in the south and along the major north-south motorway that connects the coast with the Sahel. The age distribution is also uneven; almost half of the Togolese are less than fifteen years old.
French, the official language, is used in administration and documentation. The public primary schools combine French with "Ewe" or "Kabye" as the language of instruction, depending on the region. English is spoken in neighboring Ghana and taught in Togolese secondary schools. Therefore, many Togolese, especially in the south and along the border to Ghana, speak some English. (CIA World, 2015)
The population of Togo is estimated by the UN at 8 million in 2018. The five largest cities in the country are: Lomé (capital), Sokode, Kara, Atakpame and Kpalime. In total, these cities have a population of 3.3 million and 4.7 million in the countryside. This means that 41.7% of the total population lives in urban areas. There are many different ethnic groups in Togo. It is estimated that there are up to 37 different groups. Among the largest are the Adja-Ewe/Mina with 42.4% and the Kabye/Tem with 25.9%. (2013 - 14 est.) (UN, 2019)
The population of Togo is estimated to have grown four times its size between 1960 and 2010. With almost 60% of the population under the age of 25 and a high annual growth rate, largely due to high fertility, Togo's population is expected to continue to grow in the foreseeable future. In 2008, Togo abolished fees for primary school enrolment, which led to a higher enrolment rate, but increased the pressure on limited classroom space, teachers and materials. Togo is well on the way to establishing universal primary education. However, the quality of education, the low percentage of girls and the low enrolment rate in secondary and higher education remain challenges. (CIA World, 2015)
Energy Situation
Energy Consumption
Togo's energy consumption comes from three sources: biomass, petroleum products and electricity.
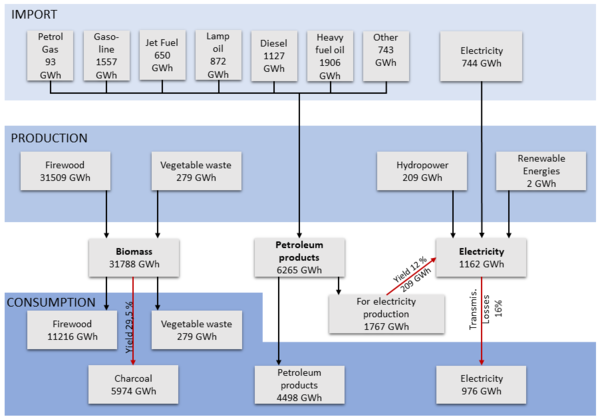
Biomass consumption comes entirely from domestic resources. The total production amounts to 31.788 GWh of primary energy, with the largest part coming from firewood and the rest from plant waste. The firewood is mainly used by households (35%), which corresponds to an energy of 11.216 GWh. Almost all the rest is converted into charcoal. The conversion takes place with an energy efficiency of 29.5%, resulting in a final consumption of 5.974 GWh. A small amount of vegetable waste with an energy of 279 GWh is also used unchanged as an energy form.
The oil products are completely imported. The largest part (72%) is consumed directly. The largest consumer here is the transport sector. The rest is used for electricity generation with an efficiency of 12% for public power stations.
The available electrical energy in Togo in 2016 is 1.162 GWh of wich 744 GWh is imported. The remaining energy comes from domestic production. The two largest energy suppliers here are hydropower with 49% and fossil fuels with 50.6%. A small part 0.4% is obtained by burning biomass or other renewable energy. The values used in the statistics refer to production from the hydraulic and thermal plants of the Communauté Electrique du Bénin (CEB) in Togo, the Compagnie Energie Electrique du Togo (CEET) and an independently managed power plant of Contour Global. The statistics are supplemented by imports from the Volta River Authority (VRA) in Ghana and the Compagnie Ivoirienne d'Electricité (CIE) in Côte d'Ivoire. In total, electricity supply of 1.162 GWh is thus achieved through distribution losses, resulting in a final electricity consumption of 876 GWh.
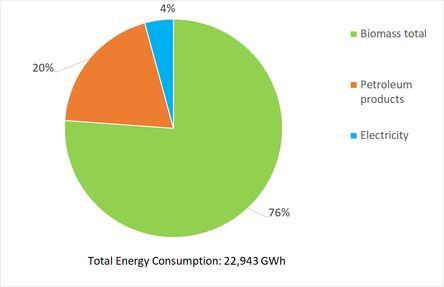
The total energy consumption of 22.943 GWh is divided into 4% electrical energy, 20% petroleum products and 76% biomass. A large part of this energy is consumed in households (73.5%), followed by the transport sector (13.2%) and the market sector (10.1%). Industry consumes a share of 3%. Households use mainly wood as a direct form of energy (56.9%) but also charcoal (33.7%). Electricity is used as a form of energy in 3.6% of households. In the transport sector, a lot of petrol (46%) and diesel (35%) is used. In industry, there is an even distribution in the consumption of electricity (36%), diesel (37%) and fuel oil (27%). (SIE, 2017)
Electrification of Togo
The rate of access to electricity in Togo is increasing (from 17% in 2000 to 45% in 2018), but with large differences between urban (access rate = 88.8%) and rural areas (access rate = 8%).
Most of the electricity produced domestically is based on hydropower and fossil fuels. The amount of electricity produced fluctuates greatly from year to year. In 2017, hydropower had a 69.1% share and the share of electricity produced by petroleum products was 24.7%.
Renewable energy sources (solar, wind, etc.) are already present in the country's electricity generation capacity and have been experiencing great growth for several years. The latest figures (2017) assume a share of 6.2%.
Most of the demand is imported from the countries of the sub-region (Ghana, Nigeria, Cote d'Ivoire...) through an interconnection network. However, the continuity of the electricity supply service is not guaranteed and constitutes a challenge for the national company CEET in charge of distribution
In recent years, progress has been made in the electrification of the country's major cities. However, great efforts are also being made for rural electrification, but it still represents a major challenge. A total of 4 million inhabitants in Togo still must be supplied with electricity.
Currently, an electrical power of 230,000 kW is produced in the country. It is estimated that in 2030 a total of 100,800,000kW of electricity will have to be produced to supply the entire population with electricity. (PERC, 2015) (Global Lightning, 2018)
The National Electrification Strategy was developed to realize this (see chapter 6). With this project, the government of Togo has set itself the goal of expanding renewable energy in particular and implementing various new strategies to provide universal access to electricity. The focus is on the expansion of solar energy for the electrification of rural areas. In addition, new opportunities for hydropower are to be developed. This technology has so far only been used in large-scale projects. In the future, however, smaller plants are also to be implemented. (CIA, 2016) (Worldbank, 2017) (SET, 2018)
|
Electricity – Overview: | |||||||
|
Electricity Access Rates (AT2ER, 2018) |
| ||||||
|
Population without electricity (AT2ER, 2018) |
| ||||||
|
Installed capacity (cumulated, 2020) |
| ||||||
|
Required capacity for 100% electrification (est. in 2030) (SET, 2018) |
| ||||||
|
Electricity – production (SIE, 2017) |
| ||||||
|
Electricity – consumption (SIE, 2017) |
| ||||||
|
Electricity – imports (SIE, 2017) |
| ||||||
|
Average cost of service (Global Lightning, 2018) |
| ||||||
|
Average tariff (2016) (Global Lightning, 2018) |
| ||||||
|
Sources of electricity production (Worldbank, 2017) |
| ||||||
|
CEET Electricity bill collection rate (CEET, 2019) |
| ||||||
Renewable Energy
Fossil Fuels
Key Problems of the Energy Sector
In accordance to Power Africa, these following challenges are the biggest for Togo's energy sector[1]:
- Limited experience with independent power producers (IPPs)
- High technical and commercial losses as a result of non-payments and aging infrastructure
- Lack of an integrated electrification strategy that aligns on- and off-grid access goals
Policy Framework, Laws and Regulations
Institutional Set up in the Energy Sector
Other Key Actors / Activities of Donors, Implementing Agencies, Civil Society Organisations
Further Information
- Togo subsidies off-grid solar to extend electricity access to all
- USAID Power Africa: Togo Factsheet
References
- ↑ Power Africa. (2018). Togo Factsheet. Retrieved from: https://www.usaid.gov/sites/default/files/documents/1860/Togo_-_November_2018_Country_Fact_Sheet.pdf


