Difference between revisions of "Energy Efficiency Planning Instruments in Brazil"
***** (***** | *****) |
***** (***** | *****) |
||
| (50 intermediate revisions by 5 users not shown) | |||
| Line 1: | Line 1: | ||
| − | |||
| − | This article informs about the selection and implementation process of different energy efficiency planning instruments in Brazil. The Brazilian Energy Planning Authority EPE (port. Empresa de Pesquisa Energética) was thereby supported by Deutsche Gesellschaft für Internationale Zusammenarbeit (GIZ) GmbH<ref name="GIZ">As a federal enterprise, the Deutsche Gesellschaft für Internationale Zusammenarbeit (GIZ) GmbH supports the federal German government in achieving its international cooperation objectives. Together, Brazil and Germany face global challenges such as preserving biodiversity and fighting climate change. The German Cooperation for Sustainable Development therefore operates primarily in two areas: Protection and sustainable management of Rain Forests as well as Renewable Energies and Energy Efficiency. Within the cooperation with the Brazilian partners GIZ provides advice on strategy development, support for developing management and cooperation structures, as well as technical expertise</ref>. | + | = Overview<br/> = |
| + | |||
| + | This article informs about the selection and implementation process of different energy efficiency planning instruments in Brazil. The Brazilian Energy Planning Authority EPE (port. Empresa de Pesquisa Energética) was thereby supported by Deutsche Gesellschaft für Internationale Zusammenarbeit (GIZ) GmbH<ref name="GIZ">As a federal enterprise, the Deutsche Gesellschaft für Internationale Zusammenarbeit (GIZ) GmbH supports the federal German government in achieving its international cooperation objectives. Together, Brazil and Germany face global challenges such as preserving biodiversity and fighting climate change. The German Cooperation for Sustainable Development therefore operates primarily in two areas: Protection and sustainable management of Rain Forests as well as Renewable Energies and Energy Efficiency. Within the cooperation with the Brazilian partners GIZ provides advice on strategy development, support for developing management and cooperation structures, as well as technical expertise</ref>. | ||
<br/> | <br/> | ||
| Line 23: | Line 24: | ||
<br/> | <br/> | ||
| − | [[:File:Assessment of the | + | [[File:Overview on the Work Packages in order to Assess Energy Efficiency.png|border|right|100px|alt=Overview on the Work Packages in order to Assess Energy Efficiency.png]][[:File:Assessment of the Current Situation and State of the Art of Energy Efficiency in Brazil.pdf|Assessment of the current situation and state of the art of energy efficiency in Brazil (2009)]] |
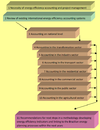
This study gives an overview on international instruments to evaluate the energy efficiency levels in a country and formats to collect and organize data for the accounting system. The authors make proposals of energy efficiency indicators for each Brazilian sector (transport, industry etc.) by applying a “top-down-approach“. Recommendations target the creation of a comprehensive monitoring database with those indicators and use it as an energy efficiency planning instrument in Brazil. | This study gives an overview on international instruments to evaluate the energy efficiency levels in a country and formats to collect and organize data for the accounting system. The authors make proposals of energy efficiency indicators for each Brazilian sector (transport, industry etc.) by applying a “top-down-approach“. Recommendations target the creation of a comprehensive monitoring database with those indicators and use it as an energy efficiency planning instrument in Brazil. | ||
| Line 29: | Line 30: | ||
<br/> | <br/> | ||
| − | [[:File:Bottom-Up Methodologies and their | + | [[:File:Bottom-Up Methodologies and their Possible Application in Brazil.pdf|Bottom-up methodologies and their possible application in Brazil (2010)]] |
The objective of this work was to provide an overview and insight on “bottom-up approaches“ (methods and data requirements) as energy efficiency planning instruments. It points out key elements like benefit-cost perspectives, net costs of energy saved and cost-potential curves. Moreover, it informs about data acquisition procedures and proposes a possible roadmap to introduce cost potential curves as an energy efficiency planning instrument in Brazil. | The objective of this work was to provide an overview and insight on “bottom-up approaches“ (methods and data requirements) as energy efficiency planning instruments. It points out key elements like benefit-cost perspectives, net costs of energy saved and cost-potential curves. Moreover, it informs about data acquisition procedures and proposes a possible roadmap to introduce cost potential curves as an energy efficiency planning instrument in Brazil. | ||
| Line 35: | Line 36: | ||
<br/> | <br/> | ||
| − | [[File:Energy | + | [[File:Energy Efficiency Potentials in EU-27.jpg|border|left|200px|Energy efficiency potentials in EU-27 in different scenarios|alt=Energy efficiency potentials in EU-27 in different scenarios]][[:File:Energy Efficiency Policy in Europe.pdf|Energy Efficiency Policy in Europe (2010)]] |
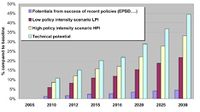
This study gives an overview on energy efficiency policies applied in Europe. With its focus being limited to end-use energy efficiency, it first gives a comprehensive overview of the European policy and market developments. Furthermore, it analyses the various types of policies implemented in the European countries and outlines good practices, e.g. energy efficiency policies are more effectively if they are bundled in policy packages. However, designing adequate policies requires a comprehensive monitoring system for energy efficiency. | This study gives an overview on energy efficiency policies applied in Europe. With its focus being limited to end-use energy efficiency, it first gives a comprehensive overview of the European policy and market developments. Furthermore, it analyses the various types of policies implemented in the European countries and outlines good practices, e.g. energy efficiency policies are more effectively if they are bundled in policy packages. However, designing adequate policies requires a comprehensive monitoring system for energy efficiency. | ||
<br/> | <br/> | ||
| − | |||
| − | |||
| − | |||
| − | |||
| − | |||
= Indicators = | = Indicators = | ||
| Line 50: | Line 46: | ||
A proven methodology for measuring energy efficiency on the macro level is the use of Energy Efficiency Indicators calculated with a “top down approach”. Indicators relate the energy consumption in a sector with a physical value (e.g. electricity consumption in MWh per build square meter m<sup>2 </sup>in the service sector) or with an economical value (e.g. primary energy consumption in MWh per GDP in Reais R$ for a national economy). The indicators can be macro economical or for a specific sector. For representing tendencies, an index can be calculated, thereby an indicator is calculated for a baseline year (represents 100%) and the value of the same indicator for the following years is given in relation to the value of the baseline year (variation in %). With this approach, it can be monitored if a policy introduced in a specific year in one sector has an impact on the energy consumption (% variation). The “top down approach” refers to the use of macro data, e.g. the energy consumption of the whole household sector, population in a country, GDP etc.<br/> | A proven methodology for measuring energy efficiency on the macro level is the use of Energy Efficiency Indicators calculated with a “top down approach”. Indicators relate the energy consumption in a sector with a physical value (e.g. electricity consumption in MWh per build square meter m<sup>2 </sup>in the service sector) or with an economical value (e.g. primary energy consumption in MWh per GDP in Reais R$ for a national economy). The indicators can be macro economical or for a specific sector. For representing tendencies, an index can be calculated, thereby an indicator is calculated for a baseline year (represents 100%) and the value of the same indicator for the following years is given in relation to the value of the baseline year (variation in %). With this approach, it can be monitored if a policy introduced in a specific year in one sector has an impact on the energy consumption (% variation). The “top down approach” refers to the use of macro data, e.g. the energy consumption of the whole household sector, population in a country, GDP etc.<br/> | ||
| − | EPE has implemented an indicator data basis for Brazil with the purpose to monitor and evaluate the effectiveness of Brazilian energy efficiency policies and to develop complementary policy measures. | + | EPE has implemented an indicator data basis for Brazil with the purpose to monitor and evaluate the effectiveness of Brazilian energy efficiency policies and to develop complementary policy measures. |
| − | |||
| − | |||
| − | |||
| − | |||
== Planning of indicators == | == Planning of indicators == | ||
| Line 70: | Line 62: | ||
<br/> | <br/> | ||
| − | [[:File:Energy | + | [[:File:Energy Efficiency Indicators for Transport.pdf|Energy efficiency indicators for transport - training on indicators (2011)]] |
ODYSSEE indicators for the transport sector were developed in accordance with basic transport indicators as shown in this presentation. Calculation modes for specific indicators for cars or road transport for goods are explained and the importance of the modal split for energy efficiency is shown. The appendix shows data sources for the transport sector and thereby how data for the monitoring of indicators can be gathered. | ODYSSEE indicators for the transport sector were developed in accordance with basic transport indicators as shown in this presentation. Calculation modes for specific indicators for cars or road transport for goods are explained and the importance of the modal split for energy efficiency is shown. The appendix shows data sources for the transport sector and thereby how data for the monitoring of indicators can be gathered. | ||
| Line 76: | Line 68: | ||
<br/> | <br/> | ||
| − | [[File:Cerâmica Vermelha.jpg|border|left|170px|alt=Cerâmica Vermelha.jpg]][[:File:Energy | + | [[File:Cerâmica Vermelha.jpg|border|left|170px|alt=Cerâmica Vermelha.jpg]][[:File:Energy Efficiency Indicators in industry.pdf|Energy efficiency indicators in industry - training on indicators (2011)]] |
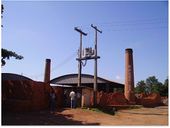
The training on indicators for the industrial sector suggests to categorize the different industrial branches in order to analyze their specific energy efficiency demands and potentials. The importance of benchmarking in order to structure indicators for the industry is explained. The second part of the training treated about indices of energy efficiency progress at industry level (ODEX) and methods for measuring savings and impacts in this sector. | The training on indicators for the industrial sector suggests to categorize the different industrial branches in order to analyze their specific energy efficiency demands and potentials. The importance of benchmarking in order to structure indicators for the industry is explained. The second part of the training treated about indices of energy efficiency progress at industry level (ODEX) and methods for measuring savings and impacts in this sector. | ||
| Line 82: | Line 74: | ||
<br/> | <br/> | ||
| − | [[:File:Households and | + | [[:File:Households and Service Sector Indicators and Surveys.pdf|Households and service sector indicators and surveys - training on indicators (2011)]] |
In the household and service sector, ODYSEE indicators were developed in accordance with measurements of the energy consumption for heating, water heating, electrical appliances and lighting. Further to the development of indicators, the training shows how surveys are conducted and evaluated to obtain data from this sector, as well as how climatic variances are included in energy efficiency calculations. | In the household and service sector, ODYSEE indicators were developed in accordance with measurements of the energy consumption for heating, water heating, electrical appliances and lighting. Further to the development of indicators, the training shows how surveys are conducted and evaluated to obtain data from this sector, as well as how climatic variances are included in energy efficiency calculations. | ||
| Line 88: | Line 80: | ||
<br/> | <br/> | ||
| − | [[File:ODYSSEE | + | [[File:ODYSSEE Energy Efficiency Indicators on-line Interface.png|border|right|200px|ODYSSEE online data request software for energy efficiency|alt=ODYSSEE On-line data request software for energy efficiency]][[:File:Structure of the ODYSSEE Database.pdf|Structure of the ODYSSEE database - training on indicators (2011)]] |
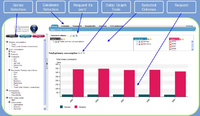
| − | The ODYSSEE database is based on an Excel template for data processing. Thereby, it guarantees transparency and reinforces control of inputs. This presentation shows how data is organized in the template, how the visualization of indicators works and where key indicators of ODYSEE are disseminated | + | The ODYSSEE database is based on an Excel template for data processing. Thereby, it guarantees transparency and reinforces control of inputs. This presentation shows how data is organized in the template, how the visualization of indicators works and where key indicators of ODYSEE are disseminated on an interactive web database (free access). |
| + | |||
| + | == Implementation of indicators == | ||
| + | |||
| + | [[:File:Consultancy for the Implementation of a High Quality and International Compatible Database on Energy Efficiency Indicators.pdf|Consultancy for the implementation of a high quality and international compatible database on energy efficiency indicators (2012)]] | ||
| + | |||
| + | After completion of the training measures on indicators, the next steps on the way to an international compatible database for energy efficiency indicators in Brazil were the implementation of a template for input data, oriented on ODYSSEE template and adapted to the special Brazilian requirements. A strategy to development to improve the data gathering was another topic. The Enerdata consultancy commissioned by GIZ developed this template and held a workshop with EPE staff to identify and enhance critical points of data acquisition. | ||
<br/> | <br/> | ||
| + | [[:File:ANNEX 1 Methodological Guidelines for ODYSSEE Data Template for Brazil (2012).pdf|Methodological guidelines for ODYSSEE data template for Brazil - ANNEX 1 - (2012)]] | ||
| − | == Implementation of indicators == | + | This document provides a methodological guideline for the data necessary for the calculation of energy efficiency indicators for a data template to be used by EPE, closely oriented on the ODYSSEE template. |
| + | |||
| + | <br/> | ||
| + | |||
| + | [[:File:Adaptations to Brazil of the ODYSSEE Data Template by EPE and Enerdata - ANNEX 2 - (2012).pdf|Adaptations to BRAZIL of the ODYSSEE data template by EPE and Enerdata - ANNEX 2 - (2012)]] | ||
| + | |||
| + | This study presents and comments some changes, inclusions and exclusions done in the ODYSSEE data template to adapt it to the Brazilian particularities. In the introduction, general changes to the template are indicated and also data adaptations for all sectors. Part of the changes aim at adapting the template to the BEN (Energy Balance for Brazil) particularly in terms of subdivisions in sectors. | ||
| + | |||
| + | <br/> | ||
| + | |||
| + | === Training on European experiences with data gathering for indicators in different sectors === | ||
| + | |||
| + | [[:File:Industry Sector Data and Surveys - Training on Indicators (2012).pdf|Industry sector data and surveys - training on indicators (2012)]] | ||
| + | |||
| + | This presentation shows the main sources for data on activities and energy consumption in the industrial sector per branch. It presents a case study from France, the survey methodology of EACI (Executive Agency for Competitiveness and Innovation). | ||
| + | |||
| + | <br/> | ||
| + | |||
| + | [[:File:Example of Houshold Survey- Case of Norway.pdf|Example of household survey case of Norway - training on indicators (2012)]] | ||
| + | |||
| + | In Norway, energy efficiency data from the household sector is gathered by the annual Survey of Consumer Expenditure, which recently added questions about energy use relating cooking, heating and fuels used in the households. | ||
| + | |||
| + | <br/> | ||
| + | |||
| + | [[:File:Service Sector Data and Surveys.pdf|Services data and surveys - training on indicators (2012)]] | ||
| + | |||
| + | In the EU countries, data for energy efficiency data in the service sector is composed from the following sources: surveys, modeling, administrative sources and auditing, measuring and metering. Analyzing the deficits of data gathering for this sector shows that few countries in the EU are providing data about energy consumption by branch and end-use. This presentation gives an overview on best practices and service sector survey methodologies of EU countries such as France, Germany, Sweden and Denmark. | ||
| + | |||
| + | <br/> | ||
| + | |||
| + | [[:File:Transport Sector Data and Surveys.pdf|Transport sector data and surveys - training on indicators (2012)]] | ||
| + | |||
| + | Indicators for transport rely on data about the stock of vehicles, their specific consumption, technical specifications and patterns of use. The presentation shows case studies explaining data gathering in France, Tunisia and Ireland. | ||
| + | |||
| + | <br/> | ||
| + | |||
| + | [[:File:ODYSSEE Indicators and Policies.pdf|ODYSSEE indicators and policies - training on indicators (2012)]] | ||
| + | |||
| + | This presentation shows how energy efficiency indicators can be used to support policy making and monitor results of energy efficiency policies. They serve to set benchmarks, to justify the public budget and help to understand when and why targets are not met. | ||
| + | |||
| + | == Publication of indicators == | ||
| + | |||
| + | Technical note about the introduction of energy efficiency indicators: Energy consumption in Brazil (2014) - | ||
| + | |||
| + | [http://bit.ly/1kRrpTZ NOTA TÉCNICA DEA 10/14: Consumo de Energia no Brasil] | ||
| + | |||
| + | This technical note aims on disseminate the results obtained by the energy efficiency indicators database in Brazil. Thereby, these results should have an impact on future energy planning. | ||
| + | |||
| + | <br/> | ||
| + | |||
| + | [[File:Capa-Iinforme nacional de monitoreo de la eficiencia energética del Brasil.png|border|left|100px|Informe nacional de monitoreo de la eficiencia energética del Brasil|alt=Informe nacional de monitoreo de la eficiencia energética del Brasil]]Monitoring the energy efficiency of Brazil - National Report - <span style="font-size: 13.6px; line-height: 20.4px; background-color: rgb(255, 255, 255)">[http://bit.ly/1Igg6JI Informe nacional de monitoreo de la eficiencia energética del Brasil (2015)]<span style="font-size: 13.6px; line-height: 20.4px; background-color: rgb(255, 255, 255)"></span></span> | ||
| + | |||
| + | In order to disseminate the results of the application of energy efficiency indicators for Brazil in Latin America, EPE published this report together with CEPAL, the Economic Commission for Latin America and the Caribbean. The cooperation was based on the idea of harmonizing the Brazilian database with other initiatives in Latin America. | ||
| + | |||
| + | <br/> | ||
| + | |||
| + | = Cost Potential Curves (CPCs) = | ||
| + | |||
| + | CSCs provide a base for decisions regarding the development of target-oriented measures to incentivize energy efficiency, they have applications in various sectors of the economy and thus support the creation of an energy efficiency market.. CSCs are an internationally established tool to graphically map the potential annual energy savings generated by technical measures (for example, substitution of electric engines in the industrial sector) and their profitability per saved energy unit (measured, for example, in Brazilian Reais BRL per MWh). “They show the quantity of conserved energy as well as the costs related to specific saving options and thus provide an indication of which options are to be preferred to ensure cost-effectiveness”.<ref name="dfss">Fleiter, et al, 2009</ref> | ||
| + | |||
| + | For this reason, CPCs are an adequate energy efficiency planning instrument to support the decision making about which measures to implement (private sector) or incentivize (public sector) because of its cost-effectiveness at first. | ||
| + | |||
| + | Using CSCs EPE intends to provide clear and quantifiable information about energy efficiency potentials in order to encourage public and private stakeholders to exploit the potential of identified energy saving measures. Thereby, stakeholders could benefit from these potentials, especially those representing potential economic savings. EPE included this instrument in the Brazilian energy planning to facilitate the introduction of public policies that stimulate energy efficiency, such as public funds and programs, as well as to measure and monitor its results. | ||
| + | |||
| + | == Planning of CPCs == | ||
| + | |||
| + | [[File:Cost Potential Curve.png|border|left|180px|alt=Cost Potential Curve.png]][[:File:Implementing Cost Potential Curves as a Planning Method for Energy Efficiency in Brazil.pdf|Implementing Conservation Supply Curves as an Energy Planning Method for Energy Efficiency in Brazil (2011)]] | ||
| + | |||
| + | The objective of this study was to bring further the process to implement CSCs as an additional tool for Energy Efficiency planning methods in Brazil by developing a strategy for the implementation and describing the methodology in detail. Therefore, a concrete and formal methodology for calculating different kinds of CSCs was formulated, steps for the implementation of CSCs from the data gathering to the use of them were described and finally a strategy for introducing CPC as a planning instrument was suggested. | ||
| + | |||
| + | == Implementation of CPCs == | ||
| + | |||
| + | The implementation phase of the CPC project started in 2012 with the data gathering for the construction of CPCs for the energy intensive industry branches and for commercial buildings. For the industry the work has been finished and since beginning of 2015 EPE is preparing the documentation for publication of the CPC. | ||
| + | |||
| + | == Publication of CPCs == | ||
| + | |||
| + | [http://bit.ly/1kRrpTZ Technical note about the introduction of energy efficiency indicators: Energy consumption in Brazil (2014) - NOTA TÉCNICA DEA 10/14: Consumo de Energia no Brasil] | ||
| + | |||
| + | On Chapter 1.3 a general introduction about the introduction of CPCs as planning instrument in Brazil is presented. Furthermore, EPE describes in that chapter the CPCs project and the progress of the construction of CCPs for the energy intensive industrial branches. | ||
| + | |||
| + | |||
| + | |||
| + | = Energy Efficiency Portal = | ||
| + | |||
| + | The energy efficiency portal is being created by EPE, supported by GIZ, in order to monitor the tendencies of energy efficiency in Brazil as well as collect and distribute news, articles, information, indicators and tools related to the topic. | ||
| + | |||
| + | [[File:Portal de eficiência EPE página 1 Flyer.png|border|center|730px|alt=Portal de eficiência EPE página 1 Flyer.png]] | ||
| − | + | As a first step in this Project the graphical design of the website and dissemination material was developed and presented to EPE. The information to be published in the portal was mapped and organized as well. Based on the defined content and design options selected by EPE for the portal, the website programming plan was elaborated. The folder in the link gives an example about the design options elaborated for the portal, the project is still in progress.<br/> | |
| − | + | [[File:Portal de eficiência EPE página 2 Flyer.png|border|center|730px|alt=Portal de eficiência EPE página 2 Flyer.png]] | |
| Line 106: | Line 191: | ||
<references /><br/> | <references /><br/> | ||
| + | [[Category:Brazil]] | ||
| + | [[Category:German_Cooperation_for_Sustainable_Development_in_Brazil]] | ||
[[Category:Energy_Efficiency]] | [[Category:Energy_Efficiency]] | ||
| − | |||
| − | |||
Latest revision as of 14:15, 23 June 2016
Overview
This article informs about the selection and implementation process of different energy efficiency planning instruments in Brazil. The Brazilian Energy Planning Authority EPE (port. Empresa de Pesquisa Energética) was thereby supported by Deutsche Gesellschaft für Internationale Zusammenarbeit (GIZ) GmbH[1].
Introduction
Energy efficiency policies still play a marginal role in Brazil. Since the beginning of the century, however, the country is gradually building a regulatory framework to develop such policies, accompanied by energy efficiency monitoring to improve future planning. In order to understand the quality and quantities of energy efficiency and to stimulate further progress in efficient use of energy, EPE aimed on a refinement and completion of their modelling and forecast methodologies. Therefore, different energy efficiency planning instruments, belonging to bottom-up and top-down approaches, were discussed before choosing the right ones for the Brazilian context, harnessing lessons-learned from other countries. The data generated by these instruments should lead to the establishment of a Brazilian energy efficiency data accounting system.
Conception / Preparation
Within the framework of designing complementary energy efficiency policies in Brazil, the first step consisted in the elaboration of a baseline study to identify the state of the art and the promotion of knowledge exchange between Brazil and other countries on best practices applying energy efficiency planning instruments and policies abroad. This chapter informs about the knowledge sharing process that afterwards led to the development of specific, demand-oriented energy efficiency planning instruments for Brazil.
State of the art of energy efficiency in Brazil and proposals for improvement - Estado da arte da eficiência energética no Brasil e propostas de melhorias (2009)
This baseline-study gives an overview about the state of the art of energy efficiency policies and monitoring systems in Brazil. The study concludes that since beginning of the century,many energy efficiency policies have been introduced and some actions have been carried on by the authorities to implement comprehensive accounting systems to monitor the energy savings induced by the policies. However, improving the monitoring system would lead to better understanding on how to complement the policy mix.
Assessment of the current situation and state of the art of energy efficiency in Brazil (2009)
This study gives an overview on international instruments to evaluate the energy efficiency levels in a country and formats to collect and organize data for the accounting system. The authors make proposals of energy efficiency indicators for each Brazilian sector (transport, industry etc.) by applying a “top-down-approach“. Recommendations target the creation of a comprehensive monitoring database with those indicators and use it as an energy efficiency planning instrument in Brazil.
Bottom-up methodologies and their possible application in Brazil (2010)
The objective of this work was to provide an overview and insight on “bottom-up approaches“ (methods and data requirements) as energy efficiency planning instruments. It points out key elements like benefit-cost perspectives, net costs of energy saved and cost-potential curves. Moreover, it informs about data acquisition procedures and proposes a possible roadmap to introduce cost potential curves as an energy efficiency planning instrument in Brazil.
Energy Efficiency Policy in Europe (2010)
This study gives an overview on energy efficiency policies applied in Europe. With its focus being limited to end-use energy efficiency, it first gives a comprehensive overview of the European policy and market developments. Furthermore, it analyses the various types of policies implemented in the European countries and outlines good practices, e.g. energy efficiency policies are more effectively if they are bundled in policy packages. However, designing adequate policies requires a comprehensive monitoring system for energy efficiency.
Indicators
A proven methodology for measuring energy efficiency on the macro level is the use of Energy Efficiency Indicators calculated with a “top down approach”. Indicators relate the energy consumption in a sector with a physical value (e.g. electricity consumption in MWh per build square meter m2 in the service sector) or with an economical value (e.g. primary energy consumption in MWh per GDP in Reais R$ for a national economy). The indicators can be macro economical or for a specific sector. For representing tendencies, an index can be calculated, thereby an indicator is calculated for a baseline year (represents 100%) and the value of the same indicator for the following years is given in relation to the value of the baseline year (variation in %). With this approach, it can be monitored if a policy introduced in a specific year in one sector has an impact on the energy consumption (% variation). The “top down approach” refers to the use of macro data, e.g. the energy consumption of the whole household sector, population in a country, GDP etc.
EPE has implemented an indicator data basis for Brazil with the purpose to monitor and evaluate the effectiveness of Brazilian energy efficiency policies and to develop complementary policy measures.
Planning of indicators
Training on Energy Efficiency Indicators for EPE - report (2011)
The training on energy efficiency indicators by EPE in September 2011 aimed to strengthen the capacity building of EPE staff in order to facilitate the implementation, completion and utilization of a Brazilian database on energy efficiency indicators. Therefore, European experiences with the ODYSSEE project[2] on energy efficiency indicators were harnessed. Due to the role of the EPE dealing with indicators and its involvement on energy demand projections, the training also established the link between indicators, as measured from statistics, and their use in energy demand forecasting models.
Introduction to indicators and ODYSSEE - training on indicators (2011)
This presentation gives an overview on quantitative energy efficiency targets, the necessity of indicators and there implementation and establishment in the EU through the ODYSSEE project. It shows that monitoring is crucial in order to accompany and reevaluate constantly the results of energy efficiency policies.
Energy efficiency indicators for transport - training on indicators (2011)
ODYSSEE indicators for the transport sector were developed in accordance with basic transport indicators as shown in this presentation. Calculation modes for specific indicators for cars or road transport for goods are explained and the importance of the modal split for energy efficiency is shown. The appendix shows data sources for the transport sector and thereby how data for the monitoring of indicators can be gathered.
Energy efficiency indicators in industry - training on indicators (2011)
The training on indicators for the industrial sector suggests to categorize the different industrial branches in order to analyze their specific energy efficiency demands and potentials. The importance of benchmarking in order to structure indicators for the industry is explained. The second part of the training treated about indices of energy efficiency progress at industry level (ODEX) and methods for measuring savings and impacts in this sector.
Households and service sector indicators and surveys - training on indicators (2011)
In the household and service sector, ODYSEE indicators were developed in accordance with measurements of the energy consumption for heating, water heating, electrical appliances and lighting. Further to the development of indicators, the training shows how surveys are conducted and evaluated to obtain data from this sector, as well as how climatic variances are included in energy efficiency calculations.
Structure of the ODYSSEE database - training on indicators (2011)
The ODYSSEE database is based on an Excel template for data processing. Thereby, it guarantees transparency and reinforces control of inputs. This presentation shows how data is organized in the template, how the visualization of indicators works and where key indicators of ODYSEE are disseminated on an interactive web database (free access).
Implementation of indicators
After completion of the training measures on indicators, the next steps on the way to an international compatible database for energy efficiency indicators in Brazil were the implementation of a template for input data, oriented on ODYSSEE template and adapted to the special Brazilian requirements. A strategy to development to improve the data gathering was another topic. The Enerdata consultancy commissioned by GIZ developed this template and held a workshop with EPE staff to identify and enhance critical points of data acquisition.
Methodological guidelines for ODYSSEE data template for Brazil - ANNEX 1 - (2012)
This document provides a methodological guideline for the data necessary for the calculation of energy efficiency indicators for a data template to be used by EPE, closely oriented on the ODYSSEE template.
Adaptations to BRAZIL of the ODYSSEE data template by EPE and Enerdata - ANNEX 2 - (2012)
This study presents and comments some changes, inclusions and exclusions done in the ODYSSEE data template to adapt it to the Brazilian particularities. In the introduction, general changes to the template are indicated and also data adaptations for all sectors. Part of the changes aim at adapting the template to the BEN (Energy Balance for Brazil) particularly in terms of subdivisions in sectors.
Training on European experiences with data gathering for indicators in different sectors
Industry sector data and surveys - training on indicators (2012)
This presentation shows the main sources for data on activities and energy consumption in the industrial sector per branch. It presents a case study from France, the survey methodology of EACI (Executive Agency for Competitiveness and Innovation).
Example of household survey case of Norway - training on indicators (2012)
In Norway, energy efficiency data from the household sector is gathered by the annual Survey of Consumer Expenditure, which recently added questions about energy use relating cooking, heating and fuels used in the households.
Services data and surveys - training on indicators (2012)
In the EU countries, data for energy efficiency data in the service sector is composed from the following sources: surveys, modeling, administrative sources and auditing, measuring and metering. Analyzing the deficits of data gathering for this sector shows that few countries in the EU are providing data about energy consumption by branch and end-use. This presentation gives an overview on best practices and service sector survey methodologies of EU countries such as France, Germany, Sweden and Denmark.
Transport sector data and surveys - training on indicators (2012)
Indicators for transport rely on data about the stock of vehicles, their specific consumption, technical specifications and patterns of use. The presentation shows case studies explaining data gathering in France, Tunisia and Ireland.
ODYSSEE indicators and policies - training on indicators (2012)
This presentation shows how energy efficiency indicators can be used to support policy making and monitor results of energy efficiency policies. They serve to set benchmarks, to justify the public budget and help to understand when and why targets are not met.
Publication of indicators
Technical note about the introduction of energy efficiency indicators: Energy consumption in Brazil (2014) -
NOTA TÉCNICA DEA 10/14: Consumo de Energia no Brasil
This technical note aims on disseminate the results obtained by the energy efficiency indicators database in Brazil. Thereby, these results should have an impact on future energy planning.
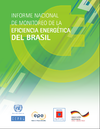
Monitoring the energy efficiency of Brazil - National Report - Informe nacional de monitoreo de la eficiencia energética del Brasil (2015)
In order to disseminate the results of the application of energy efficiency indicators for Brazil in Latin America, EPE published this report together with CEPAL, the Economic Commission for Latin America and the Caribbean. The cooperation was based on the idea of harmonizing the Brazilian database with other initiatives in Latin America.
Cost Potential Curves (CPCs)
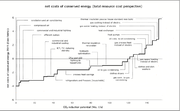
CSCs provide a base for decisions regarding the development of target-oriented measures to incentivize energy efficiency, they have applications in various sectors of the economy and thus support the creation of an energy efficiency market.. CSCs are an internationally established tool to graphically map the potential annual energy savings generated by technical measures (for example, substitution of electric engines in the industrial sector) and their profitability per saved energy unit (measured, for example, in Brazilian Reais BRL per MWh). “They show the quantity of conserved energy as well as the costs related to specific saving options and thus provide an indication of which options are to be preferred to ensure cost-effectiveness”.[3]
For this reason, CPCs are an adequate energy efficiency planning instrument to support the decision making about which measures to implement (private sector) or incentivize (public sector) because of its cost-effectiveness at first.
Using CSCs EPE intends to provide clear and quantifiable information about energy efficiency potentials in order to encourage public and private stakeholders to exploit the potential of identified energy saving measures. Thereby, stakeholders could benefit from these potentials, especially those representing potential economic savings. EPE included this instrument in the Brazilian energy planning to facilitate the introduction of public policies that stimulate energy efficiency, such as public funds and programs, as well as to measure and monitor its results.
Planning of CPCs
The objective of this study was to bring further the process to implement CSCs as an additional tool for Energy Efficiency planning methods in Brazil by developing a strategy for the implementation and describing the methodology in detail. Therefore, a concrete and formal methodology for calculating different kinds of CSCs was formulated, steps for the implementation of CSCs from the data gathering to the use of them were described and finally a strategy for introducing CPC as a planning instrument was suggested.
Implementation of CPCs
The implementation phase of the CPC project started in 2012 with the data gathering for the construction of CPCs for the energy intensive industry branches and for commercial buildings. For the industry the work has been finished and since beginning of 2015 EPE is preparing the documentation for publication of the CPC.
Publication of CPCs
On Chapter 1.3 a general introduction about the introduction of CPCs as planning instrument in Brazil is presented. Furthermore, EPE describes in that chapter the CPCs project and the progress of the construction of CCPs for the energy intensive industrial branches.
Energy Efficiency Portal
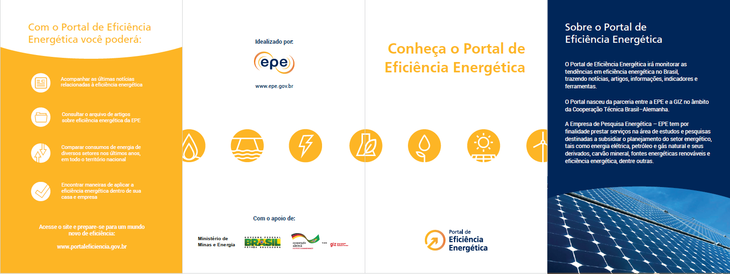
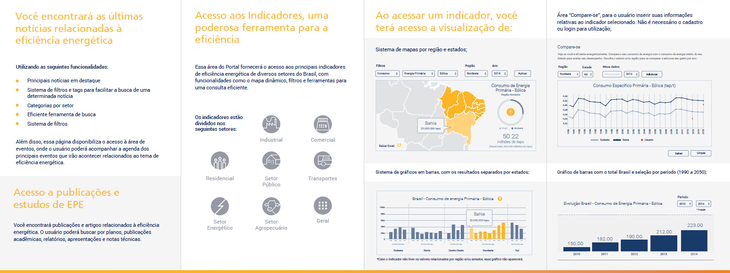
The energy efficiency portal is being created by EPE, supported by GIZ, in order to monitor the tendencies of energy efficiency in Brazil as well as collect and distribute news, articles, information, indicators and tools related to the topic.
As a first step in this Project the graphical design of the website and dissemination material was developed and presented to EPE. The information to be published in the portal was mapped and organized as well. Based on the defined content and design options selected by EPE for the portal, the website programming plan was elaborated. The folder in the link gives an example about the design options elaborated for the portal, the project is still in progress.
References
- ↑ As a federal enterprise, the Deutsche Gesellschaft für Internationale Zusammenarbeit (GIZ) GmbH supports the federal German government in achieving its international cooperation objectives. Together, Brazil and Germany face global challenges such as preserving biodiversity and fighting climate change. The German Cooperation for Sustainable Development therefore operates primarily in two areas: Protection and sustainable management of Rain Forests as well as Renewable Energies and Energy Efficiency. Within the cooperation with the Brazilian partners GIZ provides advice on strategy development, support for developing management and cooperation structures, as well as technical expertise
- ↑ More information about ODYSSEE: http://www.odyssee-mure.eu/ (Retrieved on 13th of October 2015)
- ↑ Fleiter, et al, 2009

