Difference between revisions of "Grid Connection - Wind Energy"
***** (***** | *****) |
***** (***** | *****) |
||
| Line 1: | Line 1: | ||
| − | <br> | + | == Grid configuration <br> == |
| + | |||
| + | For analyzing the grid impact of a wind farm connection at XkV, the following main aspects have to be studied:<br>• Impact on thermal limits in the surrounding subtransmssion network<br>• Impact on voltage variations at the connection point and the surrounding subtransmssion system:<br>• Impact on short circuit levels<br>• Impact on Power Quality aspects (Harmonics/Flicker, IEC 61400-21)<br>Each of these aspects requires different types of studies and modelling approaches.<ref>GTZ 2009: Grid Integration of Wind Energy in the Western Cape. p. 7 http://www.gtz.de/de/dokumente/gtz2009-en-grid-study-western-cape.pdf</ref> <br> | ||
== Impact on Thermal Limits in the Surrounding Subtransmission Network<br> == | == Impact on Thermal Limits in the Surrounding Subtransmission Network<br> == | ||
| Line 19: | Line 21: | ||
For this reason, only a probabilistic assessment considering the actual wind speed conditions at the site can provide an answer to the question, which mitigation option should finally be applied.<br> | For this reason, only a probabilistic assessment considering the actual wind speed conditions at the site can provide an answer to the question, which mitigation option should finally be applied.<br> | ||
| − | <br>Figure 2: Outage of one of the parallel 132kV lines between Laingsburg and Boskloof<ref>GTZ 2009: Grid Integration of Wind Energy in the Western Cape http://www.gtz.de/de/dokumente/gtz2009-en-grid-study-western-cape.pdf</ref><br> | + | <br> |
| + | |||
| + | Figure 2: Outage of one of the parallel 132kV lines between Laingsburg and Boskloof<ref>GTZ 2009: Grid Integration of Wind Energy in the Western Cape. pp.8 http://www.gtz.de/de/dokumente/gtz2009-en-grid-study-western-cape.pdf</ref><br> | ||
[[Image:Outage wind park example.JPG]]<br> | [[Image:Outage wind park example.JPG]]<br> | ||
| Line 25: | Line 29: | ||
<br> | <br> | ||
| − | < | + | === Probabilistic Assessment of the Non Delivered Energy in the Case of Wind Farm Limitation <br> === |
| + | |||
| + | For analyzing the second [[Grid_Connection_-_Wind_Energy#Impact on Thermal Limits in the Surrounding Subtransmission Network|mitigation option]]; that is, limiting the wind farm output to 120 MW during all times (80 % of rated output), the probability that the actually generated power exceeds a level of 80% of installed capacity has to be assessed. For this assessment, the following information is required in addition to a load flow model of the zone of interest:<br> | ||
| + | |||
| + | *Equivalent power curve of the wind farm | ||
| + | *Average wind speed and, if available, the Weibull-shape factor of the wind speed distribution. | ||
| + | |||
| + | In the case that no more detailed information is available, which is usually the case in an early planning stage; a typical power curve of a wind generator can be used as equivalent wind farm power curve. Effects, like wind-farm internal losses etc. can be considered in the equivalent wind farm power curve. <br>Based on average wind speed and shape factor, the distribution of wind-speeds can be calculated, based on a Weibull distribution. Together with the equivalent wind farm power curve, a wind generation duration curve for one wind farm can be calculated showing the probability for the case that the generated wind power exceeds a given level (see Figure 3).<br>The energy that cannot be delivered to the system can then be evaluated by calculating the area between that part of the red curve that is above the blue line indicating the wind farm limit and the blue line itself. For a monetary analysis, this area has to be multiplied by the assumed tariff.<br> | ||
| + | |||
| + | '''<br>''' | ||
| + | |||
| + | '''The example of Laingsburg (Western Cape, South Africa):'''<br> | ||
| + | |||
| + | In case of the wind farm at Laingsburg, there were no wind speed data available. For this reason, the corresponding assessment has been carried out for an assumed average wind speed of 7 m/s and 8 m/s. this assessment will provide a good idea about the order of magnitude of the monetary losses associated with a wind farm limitation and at the same time show the sensitivity of this value against average wind speed.<br>Capping a single wind farm with 7m/s average wind speed at 80% results in a not delivered energy of approximately 5% of the totally available energy. This would be equivalent to around 19 000 MWh/year, which could not be delivered. Assuming a tariff of 1,25 Rand/kWh, the resulting economic losses to the wind farm operators would be in the order of magnitude of 23 750 000 R/year.<br>If instead 8m/s average wind speed is assumed an considering also an 80% power output limit, the results indicate a not delivered energy of approximately 7,5% of the totally available energy. This would be equivalent to around 37 000 MWh/year, which could not be delivered, resulting in 46 250 000 R/year of losses.<ref>GTZ 2009: Grid Integration of Wind Energy in the Western Cape, pp.9 http://www.gtz.de/de/dokumente/gtz2009-en-grid-study-western-cape.pdf</ref><br> | ||
| − | [[ | + | [[Image:Wind_speed_example.JPG]] |
| + | <ref>GTZ 2009: Grid Integration of Wind Energy in the Western Cape. p. 11 http://www.gtz.de/de/dokumente/gtz2009-en-grid-study-western-cape.pdf</ref><br> | ||
| + | <references /><br> | ||
| + | |||
| + | [[Portal:Wind]] | ||
[[Category:Wind]] | [[Category:Wind]] | ||
| + | |||
| + | <br> | ||
Revision as of 12:01, 9 July 2011
Grid configuration
For analyzing the grid impact of a wind farm connection at XkV, the following main aspects have to be studied:
• Impact on thermal limits in the surrounding subtransmssion network
• Impact on voltage variations at the connection point and the surrounding subtransmssion system:
• Impact on short circuit levels
• Impact on Power Quality aspects (Harmonics/Flicker, IEC 61400-21)
Each of these aspects requires different types of studies and modelling approaches.[1]
Impact on Thermal Limits in the Surrounding Subtransmission Network
In a first step, it is required to verify that the existing network capacity is able to take the additionally generated power. For this purpose, credible contingencies, such as n-1 branch outages, have to be analyzed.
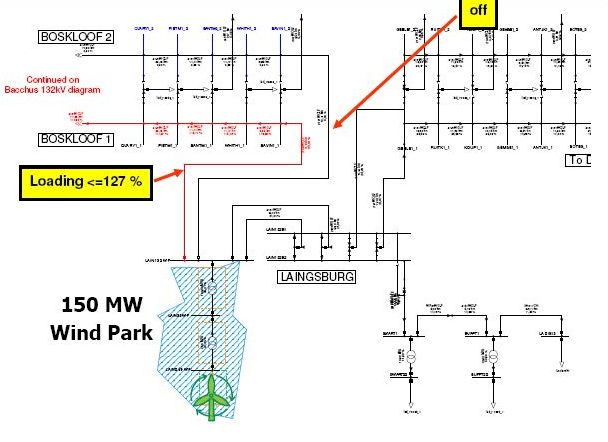
An n-1 analysis based on load flow calculations of all surrounding lines leads to the conclusion that there is a thermal overload problem in the case that one circuit between (in the example that follows) Laingsburg and Boskloof is on outage and the wind farm production is above 120MW. For all other contingencies, no thermal problems can be identified.
The worst case situation with a wind farm production of 150MW and the outage of one of the parallel circuits is depicted in Figure 2. As shown in this diagram, the circuit that will remain in service will carry a load of 127% of its thermal rating.
The general options for mitigating such problems are:
- Reinforce the existing line or build a new line.
- Limit the wind farm during all times.
- Limit wind farm output in case of actual line failure (manual or automatic inter-trip).
- Consider dynamic line rating systems.
Generally, the most economic solution under the constraint that a secure network operation is ensured should be taken. However, the costs associated with each of the four options depend on
- Length of the line
- Number of hours per year during which the overload situation occurs (and during which the wind farm output would have to be limited)
For this reason, only a probabilistic assessment considering the actual wind speed conditions at the site can provide an answer to the question, which mitigation option should finally be applied.
Figure 2: Outage of one of the parallel 132kV lines between Laingsburg and Boskloof[2]
Probabilistic Assessment of the Non Delivered Energy in the Case of Wind Farm Limitation
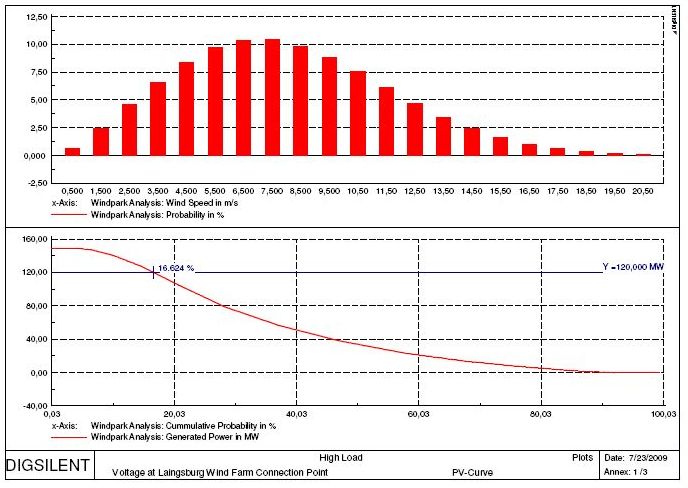
For analyzing the second mitigation option; that is, limiting the wind farm output to 120 MW during all times (80 % of rated output), the probability that the actually generated power exceeds a level of 80% of installed capacity has to be assessed. For this assessment, the following information is required in addition to a load flow model of the zone of interest:
- Equivalent power curve of the wind farm
- Average wind speed and, if available, the Weibull-shape factor of the wind speed distribution.
In the case that no more detailed information is available, which is usually the case in an early planning stage; a typical power curve of a wind generator can be used as equivalent wind farm power curve. Effects, like wind-farm internal losses etc. can be considered in the equivalent wind farm power curve.
Based on average wind speed and shape factor, the distribution of wind-speeds can be calculated, based on a Weibull distribution. Together with the equivalent wind farm power curve, a wind generation duration curve for one wind farm can be calculated showing the probability for the case that the generated wind power exceeds a given level (see Figure 3).
The energy that cannot be delivered to the system can then be evaluated by calculating the area between that part of the red curve that is above the blue line indicating the wind farm limit and the blue line itself. For a monetary analysis, this area has to be multiplied by the assumed tariff.
The example of Laingsburg (Western Cape, South Africa):
In case of the wind farm at Laingsburg, there were no wind speed data available. For this reason, the corresponding assessment has been carried out for an assumed average wind speed of 7 m/s and 8 m/s. this assessment will provide a good idea about the order of magnitude of the monetary losses associated with a wind farm limitation and at the same time show the sensitivity of this value against average wind speed.
Capping a single wind farm with 7m/s average wind speed at 80% results in a not delivered energy of approximately 5% of the totally available energy. This would be equivalent to around 19 000 MWh/year, which could not be delivered. Assuming a tariff of 1,25 Rand/kWh, the resulting economic losses to the wind farm operators would be in the order of magnitude of 23 750 000 R/year.
If instead 8m/s average wind speed is assumed an considering also an 80% power output limit, the results indicate a not delivered energy of approximately 7,5% of the totally available energy. This would be equivalent to around 37 000 MWh/year, which could not be delivered, resulting in 46 250 000 R/year of losses.[3]
- ↑ GTZ 2009: Grid Integration of Wind Energy in the Western Cape. p. 7 http://www.gtz.de/de/dokumente/gtz2009-en-grid-study-western-cape.pdf
- ↑ GTZ 2009: Grid Integration of Wind Energy in the Western Cape. pp.8 http://www.gtz.de/de/dokumente/gtz2009-en-grid-study-western-cape.pdf
- ↑ GTZ 2009: Grid Integration of Wind Energy in the Western Cape, pp.9 http://www.gtz.de/de/dokumente/gtz2009-en-grid-study-western-cape.pdf
- ↑ GTZ 2009: Grid Integration of Wind Energy in the Western Cape. p. 11 http://www.gtz.de/de/dokumente/gtz2009-en-grid-study-western-cape.pdf


