Knowledge fuels change
For over a decade, Energypedia has shared free, reliable energy expertise with the world.
We’re now facing a serious funding gap.
Help keep this platform alive — your donation, big or small, truly matters!
Thank you for your support
Difference between revisions of "Afghanistan Energy Situation"
***** (***** | *****) m |
***** (***** | *****) m |
||
| (43 intermediate revisions by 5 users not shown) | |||
| Line 1: | Line 1: | ||
| − | = | + | {{CES Country |
| + | |CES Country Name=Afghanistan | ||
| + | |CES Country Capital=Kabul | ||
| + | |CES Country Region South Asia=South Asia | ||
| + | |CES Country Coordinates=34.5333° N, 69.1333° E | ||
| + | }} | ||
| + | = Geographic and Climatic Conditions<br/> = | ||
| − | + | *Arid to semiarid; cold winters and hot summers | |
| − | + | *Mean temperature (°C min/max): 4.3/19.6 <ref name="UN Data">UN Data (2008): http://data.un.org/CountryProfile.aspx?crName=Afghanistan</ref> | |
| − | + | *Natural gas, petroleum, coal <ref name="null">CIA - The World Factbook: https://www.cia.gov/library/publications/the-world-factbook/geos/af.html</ref> | |
| − | + | *Land area covered by forest: 1.3% | |
| − | + | *Forest annual rate of change: 0% <ref>FAO (2011) The State of the World's Forest</ref> | |
| − | |||
| − | |||
| − | |||
| − | |||
| − | | | + | [[Afghanistan Energy Situation#toc|►Go to Top]] |
| − | |||
| − | + | = Socioeconomical Situation<br/> = | |
| − | |||
| − | |||
| − | + | == Income Sources == | |
| − | |||
| − | + | *Agriculture: 79% | |
| − | + | *Industry: 6% | |
| − | + | *Services: 16% | |
| − | + | <br/> | |
| − | |||
| − | + | = Energy Source = | |
| − | |||
| − | |||
| − | + | *Hydropower 63,7% | |
| − | + | *fossil fuels 35,3% | |
| − | | | + | [[Afghanistan Energy Situation#toc|►Go to Top]] |
| − | |||
| − | |||
| − | |||
| − | |||
| − | + | = Energy Consumption = | |
| − | |||
| − | |||
| − | + | == Share of Fuel Types == | |
| − | |||
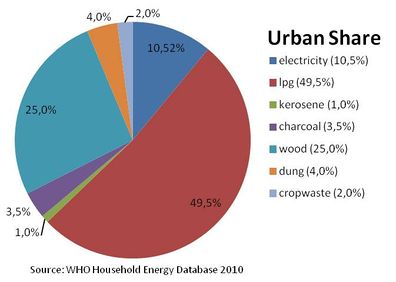
| − | + | Percentage of energy types used for cooking in urban areas <ref name="WHO 2010">WHO 2010: WHO Household Energy Database</ref> | |
| − | |||
| − | |||
| − | + | <br/> | |
| − | |||
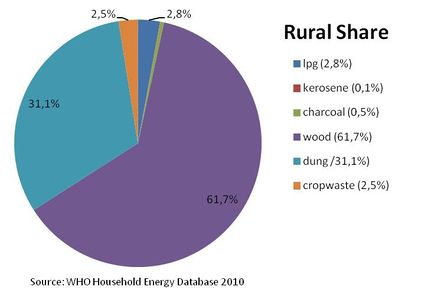
| − | | | + | [[File:Afghanistan Urban Share.jpg|thumb|center|396px|Afghanistan Urban Share.jpg|alt=Afghanistan Urban Share.jpg]]<br/>Percentage of energy types used for cooking in rural areas. <ref name="WHO 2010">WHO 2010: WHO Household Energy Database</ref><br/> |
| − | | | ||
| − | |||
| − | | | + | <br/>[[File:Afghanistan Rural Share.jpg|thumb|center|444px|Afghanistan Rural Share.jpg|alt=Afghanistan Rural Share.jpg]] |
| − | |||
| − | |||
| − | |||
| − | |||
| − | | | + | [[Afghanistan Energy Situation#toc|►Go to Top]] |
| − | |||
| − | + | == Solid Fuels == | |
| − | |||
| − | |||
| − | + | Percentage of people using solid fuels<br/> | |
| − | |||
| − | + | National: >95% <ref>WHO (2006): Fuels for Life</ref> | |
| − | |||
| − | |||
| − | | | + | [[Afghanistan Energy Situation#toc|►Go to Top]] |
| − | |||
| − | + | == Solid Fuel Use Impact on Health == | |
| − | |||
| − | |||
| − | + | Total annual deaths attributable to solid fuel use: 23900 persons<br/>Percentage of national burden of diseases attributable to solid fuel use: 4.9% <ref>WHO (2006): Fuels for Life</ref> | |
| − | |||
| − | | | + | [[Afghanistan Energy Situation#toc|►Go to Top]] |
| − | + | = Electricity Situation = | |
| − | |||
| − | |||
| − | |||
| − | |||
| − | |||
| − | + | Electrification rate in households in 2009:<ref>The National Risk and Vulnerability Assessment 2005, Kabul, Afghanistan. Cited in WHO (2009) The Energy Access Situation in developing Countries</ref> | |
| − | + | *National: 23% | |
| + | *Urban: 74% | ||
| + | *Rural: 3% | ||
| − | + | For establishing a new electricity connection in rural Afghanistan, it usually costs about USD 1200 (plus regular payments for energy consumed).<ref name="https://blogs.adb.org/blog/grid-solar-can-be-game-changer-electricity-access-central-asia">https://blogs.adb.org/blog/grid-solar-can-be-game-changer-electricity-access-central-asia</ref> | |
| − | + | [[Afghanistan Energy Situation#toc|►Go to Top]] | |
| − | |||
| − | = | + | = Further Information = |
| − | + | *[[Portal:Countries|Country portal on energypedia]] | |
| − | = | + | = References = |
| − | + | <references /> | |
| − | + | [[Afghanistan Energy Situation#toc|►Go to Top]] | |
| − | |||
| − | |||
| − | |||
| − | |||
| − | |||
| − | |||
| − | |||
| − | |||
| − | |||
| − | |||
| − | |||
| − | |||
| − | |||
| − | |||
| − | |||
| − | |||
| − | |||
| − | |||
| − | |||
| − | |||
| − | |||
| − | |||
| − | |||
| − | |||
| − | |||
| − | |||
| − | |||
| − | |||
| − | |||
| − | |||
| − | |||
| − | |||
| − | |||
| − | |||
| − | |||
| − | |||
| − | |||
| − | |||
| − | |||
| − | |||
| − | |||
| − | |||
| − | |||
| − | |||
| − | |||
| − | |||
| − | |||
| − | |||
| − | |||
| − | |||
| − | |||
| − | |||
| − | |||
| − | |||
| − | |||
| − | |||
| − | |||
| − | |||
| − | |||
| − | |||
| − | |||
| − | |||
| − | |||
| − | |||
| − | |||
| − | |||
| − | |||
| − | |||
| − | |||
| − | |||
| − | |||
| − | |||
| − | |||
| − | |||
| − | |||
| − | |||
| − | |||
| − | |||
| − | [[ | ||
Latest revision as of 18:09, 10 July 2018
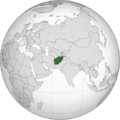
Capital:
Kabul
Region:
Coordinates:
34.5333° N, 69.1333° E
Total Area (km²): It includes a country's total area, including areas under inland bodies of water and some coastal waterways.
XML error: Mismatched tag at line 6.
Population: It is based on the de facto definition of population, which counts all residents regardless of legal status or citizenship--except for refugees not permanently settled in the country of asylum, who are generally considered part of the population of their country of origin.
XML error: Mismatched tag at line 6. ()
Rural Population (% of total population): It refers to people living in rural areas as defined by national statistical offices. It is calculated as the difference between total population and urban population.
XML error: Mismatched tag at line 6. ()
GDP (current US$): It is the sum of gross value added by all resident producers in the economy plus any product taxes and minus any subsidies not included in the value of the products. It is calculated without making deductions for depreciation of fabricated assets or for depletion and degradation of natural resources.
XML error: Mismatched tag at line 6.2 ()
GDP Per Capita (current US$): It is gross domestic product divided by midyear population
XML error: Mismatched tag at line 6. ()
Access to Electricity (% of population): It is the percentage of population with access to electricity.
XML error: Mismatched tag at line 6.no data
Energy Imports Net (% of energy use): It is estimated as energy use less production, both measured in oil equivalents. A negative value indicates that the country is a net exporter. Energy use refers to use of primary energy before transformation to other end-use fuels, which is equal to indigenous production plus imports and stock changes, minus exports and fuels supplied to ships and aircraft engaged in international transport.
XML error: Mismatched tag at line 6.no data
Fossil Fuel Energy Consumption (% of total): It comprises coal, oil, petroleum, and natural gas products.
XML error: Mismatched tag at line 6.no data
Geographic and Climatic Conditions
- Arid to semiarid; cold winters and hot summers
- Mean temperature (°C min/max): 4.3/19.6 [1]
- Natural gas, petroleum, coal [2]
- Land area covered by forest: 1.3%
- Forest annual rate of change: 0% [3]
Socioeconomical Situation
Income Sources
- Agriculture: 79%
- Industry: 6%
- Services: 16%
Energy Source
- Hydropower 63,7%
- fossil fuels 35,3%
Energy Consumption
Percentage of energy types used for cooking in urban areas [4]
Percentage of energy types used for cooking in rural areas. [4]
Solid Fuels
Percentage of people using solid fuels
National: >95% [5]
Solid Fuel Use Impact on Health
Total annual deaths attributable to solid fuel use: 23900 persons
Percentage of national burden of diseases attributable to solid fuel use: 4.9% [6]
Electricity Situation
Electrification rate in households in 2009:[7]
- National: 23%
- Urban: 74%
- Rural: 3%
For establishing a new electricity connection in rural Afghanistan, it usually costs about USD 1200 (plus regular payments for energy consumed).[8]
Further Information
References
- ↑ UN Data (2008): http://data.un.org/CountryProfile.aspx?crName=Afghanistan
- ↑ CIA - The World Factbook: https://www.cia.gov/library/publications/the-world-factbook/geos/af.html
- ↑ FAO (2011) The State of the World's Forest
- ↑ 4.0 4.1 WHO 2010: WHO Household Energy Database
- ↑ WHO (2006): Fuels for Life
- ↑ WHO (2006): Fuels for Life
- ↑ The National Risk and Vulnerability Assessment 2005, Kabul, Afghanistan. Cited in WHO (2009) The Energy Access Situation in developing Countries
- ↑ https://blogs.adb.org/blog/grid-solar-can-be-game-changer-electricity-access-central-asia


