Knowledge fuels change - Support energypedia!
For over 10 years, energypedia has been connecting energy experts around the world — helping them share knowledge, learn from each other, and accelerate the global energy transition.
Today, we ask for your support to keep this platform free and accessible to all.
Even a small contribution makes a big difference! If just 10–20% of our 60,000+ monthly visitors donated the equivalent of a cup of coffee — €5 — Energypedia would be fully funded for a whole year.
Is the knowledge you’ve gained through Energypedia this year worth €5 or more?
Your donation keeps the platform running, helps us create new knowledge products, and contributes directly to achieving SDG 7.
Thank you for your support, your donation, big or small, truly matters!
Difference between revisions of "Gabon Energy Situation"
***** (***** | *****) m (→References) |
***** (***** | *****) |
||
| (6 intermediate revisions by the same user not shown) | |||
| Line 57: | Line 57: | ||
{| border="1" cellspacing="0" cellpadding="5" style="width:100%;" | {| border="1" cellspacing="0" cellpadding="5" style="width:100%;" | ||
| − | |+ Table: Gabon’s | + | |+ Table: Gabon’s Production of Different Energy Sources 2000-2018<ref name="African Energy Commission (AFREC). (2019). Africa Energy Database. Retrieved from: https://afrec-energy.org/Docs/En/PDF/2018/statistics_2018_afrec.pdf">African Energy Commission (AFREC). (2019). Africa Energy Database. Retrieved from: https://afrec-energy.org/Docs/En/PDF/2018/statistics_2018_afrec.pdf</ref> |
|- | |- | ||
! scope="row" | Energy source | ! scope="row" | Energy source | ||
| Line 232: | Line 232: | ||
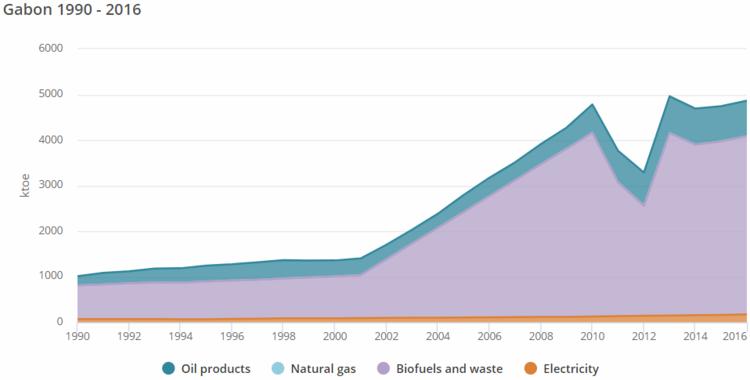
[[File:06- Gabon's final energy consumption of different energy sources 1990-2016 (IEA, 2018).PNG|thumb|center|750px|06- Gabon's final energy consumption of different energy sources 1990-2016 (IEA, 2018)]]<br/> | [[File:06- Gabon's final energy consumption of different energy sources 1990-2016 (IEA, 2018).PNG|thumb|center|750px|06- Gabon's final energy consumption of different energy sources 1990-2016 (IEA, 2018)]]<br/> | ||
| + | |||
| + | == Import and Export == | ||
| + | |||
| + | During the year 2016, Gabon's imported electricity's capacity was about 344 million kWh, with no export capacity at all, while the country's exported crude oil in the year 2017 was approximately 214,200 barrels/day<ref name="Central Intelligence Agency (CIA). (2019). The World Fact-book: Africa: Gabon. Retrieved from: https://www.cia.gov/library/Publications/the-world-factbook/geos/gb.html">Central Intelligence Agency (CIA). (2019). The World Fact-book: Africa: Gabon. Retrieved from: https://www.cia.gov/library/Publications/the-world-factbook/geos/gb.html</ref>. In the year 2015, Gabon's refined petroleum products' export capacity was around 4,662 barrels/day<ref name="Central Intelligence Agency (CIA). (2019). The World Fact-book: Africa: Gabon. Retrieved from: https://www.cia.gov/library/Publications/the-world-factbook/geos/gb.html">Central Intelligence Agency (CIA). (2019). The World Fact-book: Africa: Gabon. Retrieved from: https://www.cia.gov/library/Publications/the-world-factbook/geos/gb.html</ref>. | ||
| + | |||
| + | <br/> | ||
| + | |||
| + | {| border="1" cellspacing="0" cellpadding="5" style="width:100%;" | ||
| + | |+ Table: Gabon's Total Net Imports of Different Energy Sources 2000-2018<ref name="African Energy Commission (AFREC). (2019). Africa Energy Database. Retrieved from: https://afrec-energy.org/Docs/En/PDF/2018/statistics_2018_afrec.pdf">African Energy Commission (AFREC). (2019). Africa Energy Database. Retrieved from: https://afrec-energy.org/Docs/En/PDF/2018/statistics_2018_afrec.pdf</ref> | ||
| + | |- | ||
| + | ! scope="row" | Energy source | ||
| + | ! scope="col" | Unit | ||
| + | ! scope="col" | 2000 | ||
| + | ! scope="col" | 2005 | ||
| + | ! scope="col" | 2013 | ||
| + | ! scope="col" | 2014 | ||
| + | ! scope="col" | 2015 | ||
| + | ! scope="col" | 2016 | ||
| + | ! scope="col" | 2017 | ||
| + | ! scope="col" | 2018 | ||
| + | |- | ||
| + | ! scope="row" | Oil products | ||
| + | | Kt | ||
| + | | 808 | ||
| + | | 20 | ||
| + | | 315 | ||
| + | | 256 | ||
| + | | 253 | ||
| + | | 255 | ||
| + | | 258 | ||
| + | | 261 | ||
| + | |- | ||
| + | ! scope="row" | Electricity | ||
| + | | GWh | ||
| + | | 0 | ||
| + | | 0 | ||
| + | | 184 | ||
| + | | 388 | ||
| + | | 337 | ||
| + | | 344 | ||
| + | | 369 | ||
| + | | 403 | ||
| + | |} | ||
| + | |||
| + | <br/> | ||
| + | |||
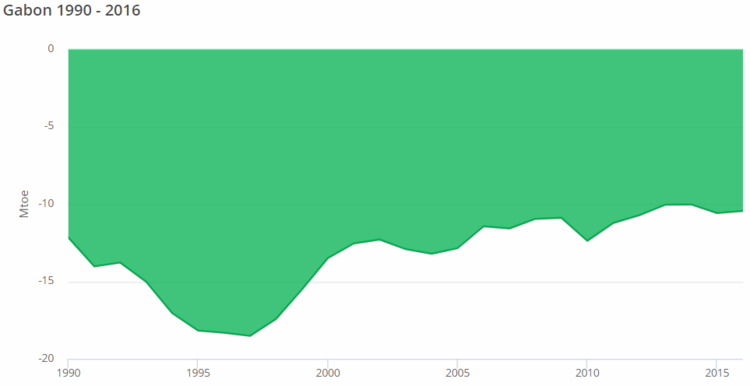
| + | [[File:07- Gabon's total net energy imports 1990-2016 (IEA, 2018).PNG|thumb|center|750px|Gabon's total net energy imports 1990-2016 (IEA, 2018)]]<br/> | ||
| + | |||
| + | == Electricity == | ||
| + | |||
| + | {| border="1" cellspacing="0" cellpadding="5" style="width:100%;" | ||
| + | |+ Table: Gabon’s Electricity Situation’s General Indicators<ref name="Central Intelligence Agency (CIA). (2019). The World Fact-book: Africa: Gabon. Retrieved from: https://www.cia.gov/library/Publications/the-world-factbook/geos/gb.html">Central Intelligence Agency (CIA). (2019). The World Fact-book: Africa: Gabon. Retrieved from: https://www.cia.gov/library/Publications/the-world-factbook/geos/gb.html</ref> | ||
| + | |- | ||
| + | ! scope="row" | <br/> | ||
| + | ! scope="col" | Production | ||
| + | ! scope="col" | Consumption | ||
| + | ! scope="col" | Exports | ||
| + | ! scope="col" | Imports | ||
| + | ! scope="col" | Installed Generation Power | ||
| + | |- | ||
| + | ! scope="row" | Capacity | ||
| + | | 2.224 billion kWh | ||
| + | | 2.071 kWh | ||
| + | | 0 kWh | ||
| + | | 344 million kWh | ||
| + | | 671000 kW | ||
| + | |- | ||
| + | ! scope="row" | World Ranking | ||
| + | | 137 | ||
| + | | 143 | ||
| + | | 137 | ||
| + | | 85 | ||
| + | | 137 | ||
| + | |} | ||
| + | |||
| + | <br/> | ||
| + | |||
| + | {| border="1" cellspacing="0" cellpadding="5" style="width:100%;" | ||
| + | |+ Table: Gabon's both Total Production and Final Consumption capacities of Electricity (GWh) 2000-2018<ref name="African Energy Commission (AFREC). (2019). Africa Energy Database. Retrieved from: https://afrec-energy.org/Docs/En/PDF/2018/statistics_2018_afrec.pdf">African Energy Commission (AFREC). (2019). Africa Energy Database. Retrieved from: https://afrec-energy.org/Docs/En/PDF/2018/statistics_2018_afrec.pdf</ref> | ||
| + | |- | ||
| + | ! scope="row" | Year | ||
| + | ! scope="col" | 2000 | ||
| + | ! scope="col" | 2005 | ||
| + | ! scope="col" | 2013 | ||
| + | ! scope="col" | 2014 | ||
| + | ! scope="col" | 2015 | ||
| + | ! scope="col" | 2016 | ||
| + | ! scope="col" | 2017 | ||
| + | ! scope="col" | 2018 | ||
| + | |- | ||
| + | ! scope="row" | Production | ||
| + | | 1147 | ||
| + | | 1385 | ||
| + | | 2266 | ||
| + | | 3219 | ||
| + | | 3378 | ||
| + | | 3092 | ||
| + | | 3196 | ||
| + | | 3310 | ||
| + | |- | ||
| + | ! scope="row" | Consumption | ||
| + | | 989 | ||
| + | | 1184 | ||
| + | | 1736 | ||
| + | | 1997 | ||
| + | | 2104 | ||
| + | | 2017 | ||
| + | | 2133 | ||
| + | | 2259 | ||
| + | |} | ||
| + | |||
| + | <br/> | ||
| + | |||
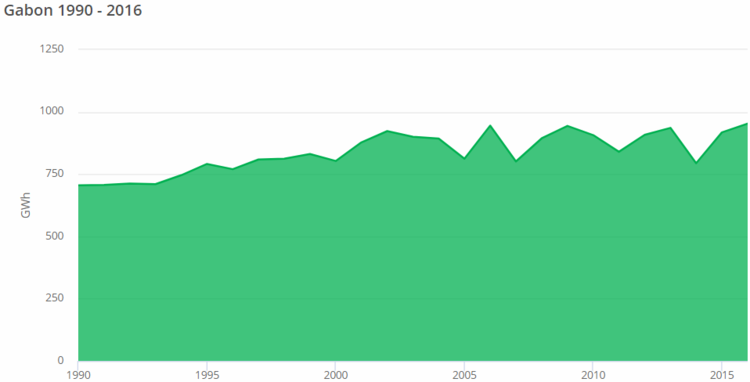
| + | [[File:10- Gabon's renewable generated electricity by source 1990-2016 (IEA, 2019).PNG|thumb|center|750px|Gabon's renewable generated electricity by source 1990-2016 (IEA, 2019)]]<br/> | ||
| + | |||
| + | == Energy Security == | ||
= Renewable Energy = | = Renewable Energy = | ||
| + | |||
| + | == General Indicators == | ||
| + | |||
| + | {| border="1" cellspacing="0" cellpadding="5" style="width:100%;" | ||
| + | |+ Table: Gabon’s Total Renewable Energy Capacity in MW 2009-2018<ref name="Whiteman, A. Esparrago, J. Rueda, S. Elsayed, S. & Arkhipove, I. (2019). Renewable Energy Statistics 2019. Retrieved from: https://www.irena.org/-/media/Files/IRENA/Agency/Publication/2019/Mar/IRENA_RE_Capacity_Statistics_2019.pdf">Whiteman, A. Esparrago, J. Rueda, S. Elsayed, S. & Arkhipove, I. (2019). Renewable Energy Statistics 2019. Retrieved from: https://www.irena.org/-/media/Files/IRENA/Agency/Publication/2019/Mar/IRENA_RE_Capacity_Statistics_2019.pdf</ref> | ||
| + | |- | ||
| + | ! scope="row" | Year | ||
| + | ! scope="col" | 2009 | ||
| + | ! scope="col" | 2010 | ||
| + | ! scope="col" | 2011 | ||
| + | ! scope="col" | 2012 | ||
| + | ! scope="col" | 2013 | ||
| + | ! scope="col" | 2014 | ||
| + | ! scope="col" | 2015 | ||
| + | ! scope="col" | 2016 | ||
| + | ! scope="col" | 2017 | ||
| + | ! scope="col" | 2018 | ||
| + | |- | ||
| + | ! scope="row" | Capacity | ||
| + | | 172 | ||
| + | | 172 | ||
| + | | 172 | ||
| + | | 172 | ||
| + | | 332 | ||
| + | | 332 | ||
| + | | 333 | ||
| + | | 333 | ||
| + | | 333 | ||
| + | | 333 | ||
| + | |} | ||
| + | |||
| + | <br/> | ||
| + | |||
| + | [[File:08- Renewable energy share in Gabon's final energy consumption 1990-2015 (Tracking SDG7, 2019).PNG|frame|center|500px|Renewable energy share in Gabon's final energy consumption 1990-2015 (Tracking SDG7, 2019)]]<br/> | ||
| + | |||
| + | [[File:09- Gabon's renewable energy consumption by source in 2015 (Tracking SDG7, 2019).PNG|thumb|center|500px|Gabon's renewable energy consumption by source in 2015 (Tracking SDG7, 2019)]]<br/> | ||
| + | |||
| + | == Solar == | ||
| + | |||
| + | Gabon has an average of 300 sun-shining days per year, with an average daily solar insolation of approximately 4 kWh/m<sup>2</sup><ref name="Lund, H.G. & Mabirizi, F. (2017). Atlas of Africa Energy Resources. Retrieved from: https://www.icafrica.org/fileadmin/documents/Publications/Africa_Energy_Atlas.pdf">Lund, H.G. & Mabirizi, F. (2017). Atlas of Africa Energy Resources. Retrieved from: https://www.icafrica.org/fileadmin/documents/Publications/Africa_Energy_Atlas.pdf</ref>. Yet, as mentioned earlier, the country is heavily forested, which stands in the way of connecting remote communities to the country's main grid<ref name="Lund, H.G. & Mabirizi, F. (2017). Atlas of Africa Energy Resources. Retrieved from: https://www.icafrica.org/fileadmin/documents/Publications/Africa_Energy_Atlas.pdf">Lund, H.G. & Mabirizi, F. (2017). Atlas of Africa Energy Resources. Retrieved from: https://www.icafrica.org/fileadmin/documents/Publications/Africa_Energy_Atlas.pdf</ref>. Therefore, <span style="background-color: rgb(255, 255, 255);">with such solar conditions, </span>stand-alone solar systems would be the ideal solution for power generation for these communities in Gabon<ref name="Lund, H.G. & Mabirizi, F. (2017). Atlas of Africa Energy Resources. Retrieved from: https://www.icafrica.org/fileadmin/documents/Publications/Africa_Energy_Atlas.pdf">Lund, H.G. & Mabirizi, F. (2017). Atlas of Africa Energy Resources. Retrieved from: https://www.icafrica.org/fileadmin/documents/Publications/Africa_Energy_Atlas.pdf</ref>. | ||
| + | |||
| + | <br/> | ||
| + | |||
| + | {| border="1" cellspacing="0" cellpadding="5" style="width:100%;" | ||
| + | |+ Table: Gabon's Total Solar Capacity in MW 2009-2018<ref name="Whiteman, A. Esparrago, J. Rueda, S. Elsayed, S. & Arkhipove, I. (2019). Renewable Energy Statistics 2019. Retrieved from: https://www.irena.org/-/media/Files/IRENA/Agency/Publication/2019/Mar/IRENA_RE_Capacity_Statistics_2019.pdf">Whiteman, A. Esparrago, J. Rueda, S. Elsayed, S. & Arkhipove, I. (2019). Renewable Energy Statistics 2019. Retrieved from: https://www.irena.org/-/media/Files/IRENA/Agency/Publication/2019/Mar/IRENA_RE_Capacity_Statistics_2019.pdf</ref> | ||
| + | |- | ||
| + | ! scope="row" | Year | ||
| + | ! scope="col" | 2009 | ||
| + | ! scope="col" | 2010 | ||
| + | ! scope="col" | 2011 | ||
| + | ! scope="col" | 2012 | ||
| + | ! scope="col" | 2013 | ||
| + | ! scope="col" | 2014 | ||
| + | ! scope="col" | 2015 | ||
| + | ! scope="col" | 2016 | ||
| + | ! scope="col" | 2017 | ||
| + | ! scope="col" | 2018 | ||
| + | |- | ||
| + | ! scope="row" | Capacity | ||
| + | | 1 | ||
| + | | 1 | ||
| + | | 1 | ||
| + | | 1 | ||
| + | | 1 | ||
| + | | 1 | ||
| + | | 1 | ||
| + | | 1 | ||
| + | | 1 | ||
| + | | 1 | ||
| + | |} | ||
| + | |||
| + | <br/> | ||
| + | |||
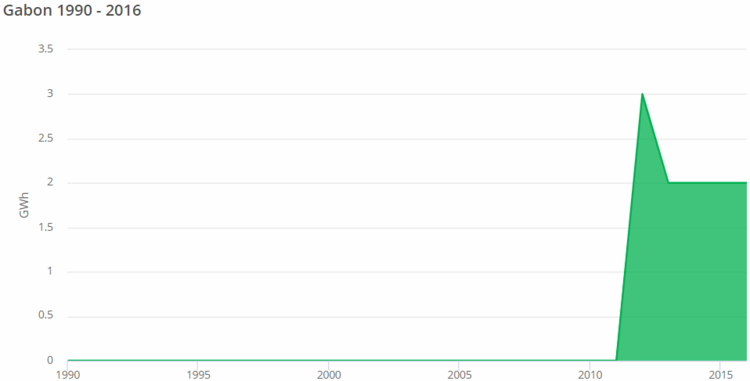
| + | [[File:11- Gabon's solar generated electricity 1990-2016 (IEA, 2019).PNG|thumb|center|750px|Gabon's solar generated electricity 1990-2016 (IEA, 2019)]]<br/> | ||
| + | |||
| + | == Hydropower == | ||
| + | |||
| + | According to the African Development Bank (ADB), Gabon has a hydro generating potential that ranges between 5000-6000 MW, yet as many other countries in the region, that potential is still far from being met to its fullest<ref name="Nachmany, M. Fankhauser, S. Davidová, J. Kingsmill, N. Landesman, T. Roppongi, H. Schleifer, P. Setzer, J. Sharman, A. Singleton, C.S. Sundaresan, J. & Townshend, T. (2015). Climate Change Legislation in Gabon: An Excerpt from the 2015 Global Climate Legislation Study – A Review of Climate Change in 99 Countries. Retrieved from: http://www.lse.ac.uk/GranthamInstitute/wp-content/uploads/2015/05/GABON.pdf">Nachmany, M. Fankhauser, S. Davidová, J. Kingsmill, N. Landesman, T. Roppongi, H. Schleifer, P. Setzer, J. Sharman, A. Singleton, C.S. Sundaresan, J. & Townshend, T. (2015). Climate Change Legislation in Gabon: An Excerpt from the 2015 Global Climate Legislation Study – A Review of Climate Change in 99 Countries. Retrieved from: http://www.lse.ac.uk/GranthamInstitute/wp-content/uploads/2015/05/GABON.pdf</ref>. | ||
| + | |||
| + | <br/> | ||
| + | |||
| + | {| border="1" cellspacing="0" cellpadding="5" style="width:100%;" | ||
| + | |+ Table: Gabon's Total Hydro Installed Capacity in MW 2009-2018<ref name="Whiteman, A. Esparrago, J. Rueda, S. Elsayed, S. & Arkhipove, I. (2019). Renewable Energy Statistics 2019. Retrieved from: https://www.irena.org/-/media/Files/IRENA/Agency/Publication/2019/Mar/IRENA_RE_Capacity_Statistics_2019.pdf">Whiteman, A. Esparrago, J. Rueda, S. Elsayed, S. & Arkhipove, I. (2019). Renewable Energy Statistics 2019. Retrieved from: https://www.irena.org/-/media/Files/IRENA/Agency/Publication/2019/Mar/IRENA_RE_Capacity_Statistics_2019.pdf</ref> | ||
| + | |- | ||
| + | ! scope="row" | Year | ||
| + | ! scope="col" | 2009 | ||
| + | ! scope="col" | 2010 | ||
| + | ! scope="col" | 2011 | ||
| + | ! scope="col" | 2012 | ||
| + | ! scope="col" | 2013 | ||
| + | ! scope="col" | 2014 | ||
| + | ! scope="col" | 2015 | ||
| + | ! scope="col" | 2016 | ||
| + | ! scope="col" | 2017 | ||
| + | ! scope="col" | 2018 | ||
| + | |- | ||
| + | ! scope="row" | Capacity | ||
| + | | 170 | ||
| + | | 170 | ||
| + | | 170 | ||
| + | | 170 | ||
| + | | 330 | ||
| + | | 330 | ||
| + | | 330 | ||
| + | | 330 | ||
| + | | 330 | ||
| + | | 330 | ||
| + | |} | ||
| + | |||
| + | <br/> | ||
| + | |||
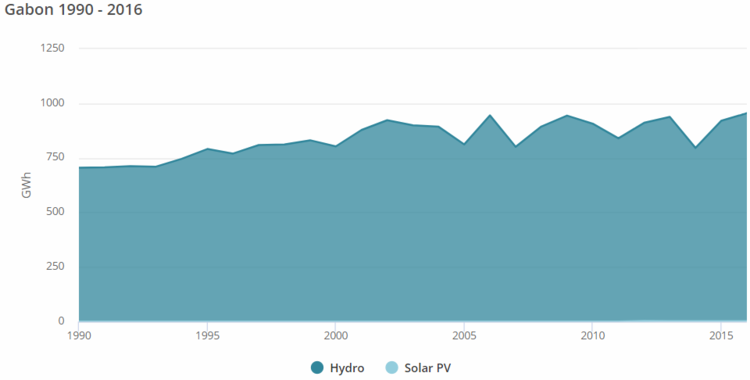
| + | [[File:12- Gabon's hydro generated electricity 1990-2016 (IEA, 2019).PNG|thumb|center|750px|Gabon's hydro generated electricity 1990-2016 (IEA, 2019)]]<br/> | ||
= Fossil Fuels = | = Fossil Fuels = | ||
| + | |||
| + | == Oil == | ||
| + | |||
| + | The Port-Gentil area is where Gabon's main oil fields are located, both on-shore and off-shore<ref name="Lund, H.G. & Mabirizi, F. (2017). Atlas of Africa Energy Resources. Retrieved from: https://www.icafrica.org/fileadmin/documents/Publications/Africa_Energy_Atlas.pdf">Lund, H.G. & Mabirizi, F. (2017). Atlas of Africa Energy Resources. Retrieved from: https://www.icafrica.org/fileadmin/documents/Publications/Africa_Energy_Atlas.pdf</ref>. | ||
| + | |||
| + | <br/> | ||
| + | |||
| + | {| border="1" cellspacing="0" cellpadding="5" style="width:100%;" | ||
| + | |+ Table: Proved Gabonese Oil Reserves since 1980 (1000 million barrels)<ref name="BP. (2018). BP Statistical Review of World Energy. Retrieved from: https://www.bp.com/en/global/corporate/energy-economics/statistical-review-of-world-energy/downloads.html">BP. (2018). BP Statistical Review of World Energy. Retrieved from: https://www.bp.com/en/global/corporate/energy-economics/statistical-review-of-world-energy/downloads.html</ref> | ||
| + | |- | ||
| + | ! scope="row" | Year | ||
| + | ! scope="col" | 1980 | ||
| + | ! scope="col" | 1990 | ||
| + | ! scope="col" | 2000 | ||
| + | ! scope="col" | 2010 | ||
| + | ! scope="col" | 2015 | ||
| + | ! scope="col" | 2016 | ||
| + | ! scope="col" | 2017 | ||
| + | |- | ||
| + | ! scope="row" | Reserves | ||
| + | | 0.5 | ||
| + | | 0.9 | ||
| + | | 2.4 | ||
| + | | 2 | ||
| + | | 2 | ||
| + | | 2 | ||
| + | | 2 | ||
| + | |} | ||
| + | |||
| + | <br/> | ||
| + | |||
| + | {| border="1" cellspacing="0" cellpadding="5" style="width:100%;" | ||
| + | |+ Table: Oil Production in Gabon since 1965 (1000 barrels/day)<ref name="BP. (2018). BP Statistical Review of World Energy. Retrieved from: https://www.bp.com/en/global/corporate/energy-economics/statistical-review-of-world-energy/downloads.html">BP. (2018). BP Statistical Review of World Energy. Retrieved from: https://www.bp.com/en/global/corporate/energy-economics/statistical-review-of-world-energy/downloads.html</ref> | ||
| + | |- | ||
| + | ! scope="row" | Year | ||
| + | ! scope="col" | 1965 | ||
| + | ! scope="col" | 1975 | ||
| + | ! scope="col" | 1985 | ||
| + | ! scope="col" | 1995 | ||
| + | ! scope="col" | 2000 | ||
| + | ! scope="col" | 2005 | ||
| + | ! scope="col" | 2010 | ||
| + | ! scope="col" | 2015 | ||
| + | ! scope="col" | 2016 | ||
| + | ! scope="col" | 2017 | ||
| + | |- | ||
| + | ! scope="row" | Produced capacity | ||
| + | | 25 | ||
| + | | 227 | ||
| + | | 173 | ||
| + | | 356 | ||
| + | | 276 | ||
| + | | 270 | ||
| + | | 249 | ||
| + | | 225 | ||
| + | | 220 | ||
| + | | 200 | ||
| + | |} | ||
| + | |||
| + | <br/> | ||
| + | |||
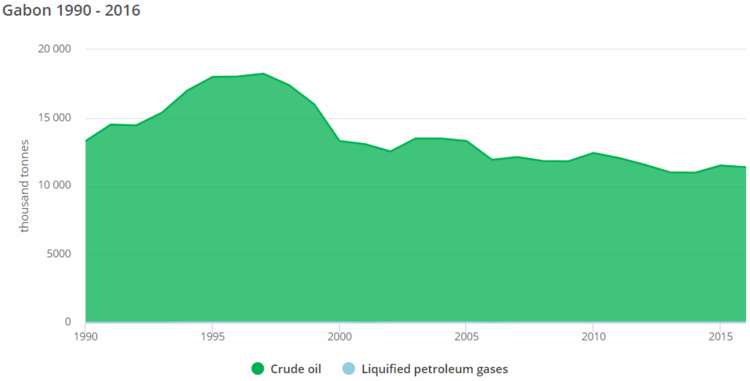
| + | [[File:13- Gabonese crude oil production 1990-2016 (IEA, 2019).PNG|thumb|center|750px|Gabonese crude oil production 1990-2016 (IEA, 2019)]]<br/> | ||
| + | |||
| + | {| border="1" cellspacing="0" cellpadding="5" style="width:100%;" | ||
| + | |+ Table: Gabonese Refinery & Oil Products' Output & Final Consumption (Kt) 2000-2018<ref name="African Energy Commission (AFREC). (2019). Africa Energy Database. Retrieved from: https://afrec-energy.org/Docs/En/PDF/2018/statistics_2018_afrec.pdf">African Energy Commission (AFREC). (2019). Africa Energy Database. Retrieved from: https://afrec-energy.org/Docs/En/PDF/2018/statistics_2018_afrec.pdf</ref> | ||
| + | |- | ||
| + | ! scope="row" | Year | ||
| + | ! scope="col" | 2000 | ||
| + | ! scope="col" | 2005 | ||
| + | ! scope="col" | 2013 | ||
| + | ! scope="col" | 2014 | ||
| + | ! scope="col" | 2015 | ||
| + | ! scope="col" | 2016 | ||
| + | ! scope="col" | 2017 | ||
| + | ! scope="col" | 2018 | ||
| + | |- | ||
| + | ! scope="row" | Produced Capacity | ||
| + | | 599 | ||
| + | | 706 | ||
| + | | 797 | ||
| + | | 774 | ||
| + | | 762 | ||
| + | | 826 | ||
| + | | 886 | ||
| + | | 951 | ||
| + | |- | ||
| + | ! scope="row" | Final Consumption | ||
| + | | 311 | ||
| + | | 350 | ||
| + | | 761 | ||
| + | | 741 | ||
| + | | 728 | ||
| + | | 753 | ||
| + | | 771 | ||
| + | | 791 | ||
| + | |} | ||
| + | |||
| + | <br/> | ||
| + | |||
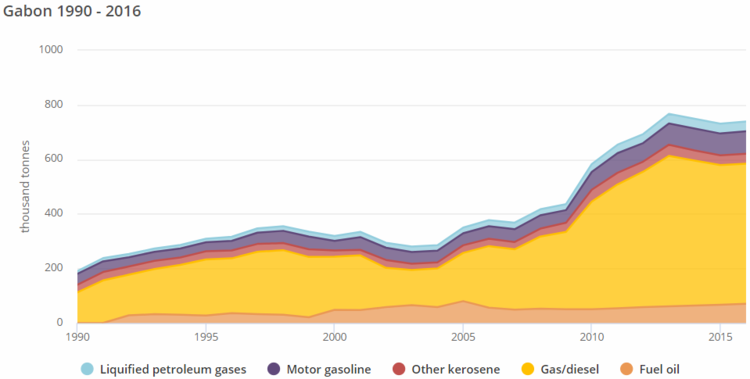
| + | [[File:14- Gabonese oil products consumption 1990-2016 (IEA, 2019).PNG|thumb|center|750px|Gabonese oil products consumption 1990-2016 (IEA, 2019)]]<br/> | ||
= Key Problems of the Energy Sector = | = Key Problems of the Energy Sector = | ||
| + | |||
| + | There is rarely any proper recent research papers on the challenges that the Gabonese energy sector faces currently. The only proper source that could be used for this chapter goes back to 1988, which makes its applicability questionable in 2019, but it can be found under "[http://documents.worldbank.org/curated/en/270931468751552994/pdf/multi-page.pdf Gabon: Issues and Options in the Energy Sector]". | ||
= Policy Framework, Laws and Regulations = | = Policy Framework, Laws and Regulations = | ||
| Line 246: | Line 576: | ||
= Further Information = | = Further Information = | ||
| − | |||
= References = | = References = | ||
<references /><br/> | <references /><br/> | ||
Latest revision as of 12:21, 5 August 2019
Capital:
Libreville
Region:
Coordinates:
1.073968° S, 10.85873° E
Total Area (km²): It includes a country's total area, including areas under inland bodies of water and some coastal waterways.
XML error: Mismatched tag at line 6.
Population: It is based on the de facto definition of population, which counts all residents regardless of legal status or citizenship--except for refugees not permanently settled in the country of asylum, who are generally considered part of the population of their country of origin.
XML error: Mismatched tag at line 6. ()
Rural Population (% of total population): It refers to people living in rural areas as defined by national statistical offices. It is calculated as the difference between total population and urban population.
XML error: Mismatched tag at line 6. ()
GDP (current US$): It is the sum of gross value added by all resident producers in the economy plus any product taxes and minus any subsidies not included in the value of the products. It is calculated without making deductions for depreciation of fabricated assets or for depletion and degradation of natural resources.
XML error: Mismatched tag at line 6.2 ()
GDP Per Capita (current US$): It is gross domestic product divided by midyear population
XML error: Mismatched tag at line 6. ()
Access to Electricity (% of population): It is the percentage of population with access to electricity.
XML error: Mismatched tag at line 6.no data
Energy Imports Net (% of energy use): It is estimated as energy use less production, both measured in oil equivalents. A negative value indicates that the country is a net exporter. Energy use refers to use of primary energy before transformation to other end-use fuels, which is equal to indigenous production plus imports and stock changes, minus exports and fuels supplied to ships and aircraft engaged in international transport.
XML error: Mismatched tag at line 6.no data
Fossil Fuel Energy Consumption (% of total): It comprises coal, oil, petroleum, and natural gas products.
XML error: Mismatched tag at line 6.no data
Introduction
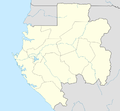
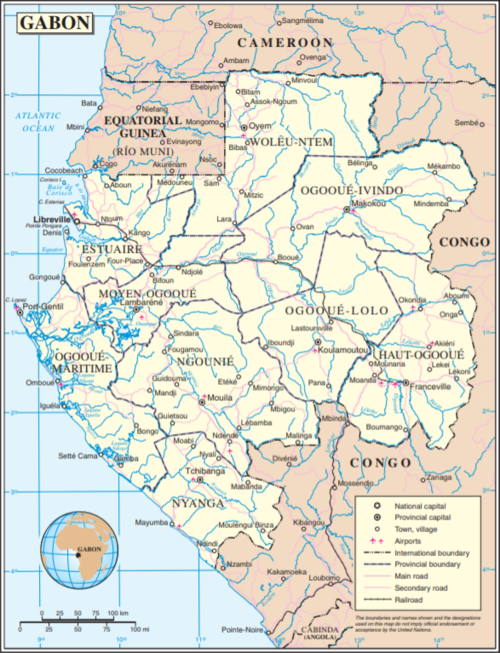
Gabon lies on the equator, and located on the far west coast of Cengtral Africa. The country borders 3 countries & the Gulf of Guinea; to the north-west is Equatorial Guinea, to the north is Cameroon & to both east & south is the Republic of Congo, while the Gulf of Guinea is to the west.
Energy Situation
Overview of the Country's Energy Sources
Gabon's total land area is about 85% forest, which makes biomass a predominant energy source for supplying the country's domestic sector needs in particular[1][2]. Gabon has also high potential for hydro-electric generation due to its topography and high-precipitation conditions[1].
In terms of proven and recoverable oil reserves, the country is considered to be one of the richest in sub-Sharan Africa, ranking the 5th largest in the continent (After Nigeria, Angola, Sudan, South Sudan & Uganda)[1][2]. It also ranks as the 3rd largest oil producer in sub-Saharan Africa; following Nigeria & Angola[1].
The country's two main energy sources are fossil-fuels and hydropower[1]. 51.7% of Gabon's total produced electricity in 2015 were generated from hydro, and 48.2% were from fossil fuels[1]. Gabon relies heavily on oil for both its export revenues & its domestic energy production[3]. The other major energy source is hydropower, from which the country's government aims to produce up to 1200 MW by 2020[3].
Energy Access
Compared to other countries in the region, Gabon has a good electrification rate with approximately 91.4% of the total population has access to electricity, leaving about 200,000 citizens lacking it[4][5].
As shown in the following figure, Gabon's electrification rate has been steadily on the rise between the late 90s and 2008. The electrification rate witnessed a significant rise between 2008-2010, yet it started to slow down from 2010 until 2013, when it started to steadily increase again until recently.
Gabon's urban electrification rate reached almost 97.5% by 2017, while the rural electrification rate was 50% at the same year, as shown the next 2 figures respectively.
Production
| Energy source | Unit | 2000 | 2005 | 2013 | 2014 | 2015 | 2016 | 2017 | 2018 |
|---|---|---|---|---|---|---|---|---|---|
| Charcoal | kt | 15 | 18 | 21 | 21 | 22 | 22 | 23 | 23 |
| Crude oil | kt | 13797 | 13477 | 11608 | 11607 | 11147 | 9993 | 10014 | 10137 |
| Natural gas | TJ | 3134 | 3917 | 11755 | 56334 | 20750 | 20900 | 20778 | 21022 |
| Hydro-electricity | GWh | 809 | 819 | 932 | 795 | 862 | 930 | 1013 | 1104 |
| Electricity from renewables | GWh | 0 | 0 | 4 | 6 | 2 | 2 | 2 | 2 |
| Oil products | kt | 599 | 706 | 797 | 774 | 762 | 826 | 886 | 951 |
Installed Capacity
| Year | 2011 | 2012 | 2013 | 2014 | 2015 | 2016 | 2017 | 2018 |
|---|---|---|---|---|---|---|---|---|
| Renewables | 170.2 | 170.2 | 330.2 | 330.2 | 330.2 | 330.3 | 332.9 | 332.9 |
| Hydro | 170.2 | 170.2 | 330.2 | 330.2 | 330.2 | 330.3 | 330.3 | 330.3 |
Consumption
| Energy source | Unit | 2000 | 2005 | 2013 | 2014 | 2015 | 2016 | 2017 | 2018 |
|---|---|---|---|---|---|---|---|---|---|
| Oil | Kt | 311 | 350 | 761 | 741 | 728 | 753 | 771 | 791 |
| Natural gas | TJ | 56 | 66 | 93 | 110 | 114 | 116 | 125 | 136 |
| Electricity | GWh | 989 | 1184 | 1736 | 1997 | 2104 | 2107 | 2133 | 2259 |
Import and Export
During the year 2016, Gabon's imported electricity's capacity was about 344 million kWh, with no export capacity at all, while the country's exported crude oil in the year 2017 was approximately 214,200 barrels/day[4]. In the year 2015, Gabon's refined petroleum products' export capacity was around 4,662 barrels/day[4].
| Energy source | Unit | 2000 | 2005 | 2013 | 2014 | 2015 | 2016 | 2017 | 2018 |
|---|---|---|---|---|---|---|---|---|---|
| Oil products | Kt | 808 | 20 | 315 | 256 | 253 | 255 | 258 | 261 |
| Electricity | GWh | 0 | 0 | 184 | 388 | 337 | 344 | 369 | 403 |
Electricity
| Production | Consumption | Exports | Imports | Installed Generation Power | |
|---|---|---|---|---|---|
| Capacity | 2.224 billion kWh | 2.071 kWh | 0 kWh | 344 million kWh | 671000 kW |
| World Ranking | 137 | 143 | 137 | 85 | 137 |
| Year | 2000 | 2005 | 2013 | 2014 | 2015 | 2016 | 2017 | 2018 |
|---|---|---|---|---|---|---|---|---|
| Production | 1147 | 1385 | 2266 | 3219 | 3378 | 3092 | 3196 | 3310 |
| Consumption | 989 | 1184 | 1736 | 1997 | 2104 | 2017 | 2133 | 2259 |
Energy Security
Renewable Energy
General Indicators
| Year | 2009 | 2010 | 2011 | 2012 | 2013 | 2014 | 2015 | 2016 | 2017 | 2018 |
|---|---|---|---|---|---|---|---|---|---|---|
| Capacity | 172 | 172 | 172 | 172 | 332 | 332 | 333 | 333 | 333 | 333 |
Solar
Gabon has an average of 300 sun-shining days per year, with an average daily solar insolation of approximately 4 kWh/m2[1]. Yet, as mentioned earlier, the country is heavily forested, which stands in the way of connecting remote communities to the country's main grid[1]. Therefore, with such solar conditions, stand-alone solar systems would be the ideal solution for power generation for these communities in Gabon[1].
| Year | 2009 | 2010 | 2011 | 2012 | 2013 | 2014 | 2015 | 2016 | 2017 | 2018 |
|---|---|---|---|---|---|---|---|---|---|---|
| Capacity | 1 | 1 | 1 | 1 | 1 | 1 | 1 | 1 | 1 | 1 |
Hydropower
According to the African Development Bank (ADB), Gabon has a hydro generating potential that ranges between 5000-6000 MW, yet as many other countries in the region, that potential is still far from being met to its fullest[3].
| Year | 2009 | 2010 | 2011 | 2012 | 2013 | 2014 | 2015 | 2016 | 2017 | 2018 |
|---|---|---|---|---|---|---|---|---|---|---|
| Capacity | 170 | 170 | 170 | 170 | 330 | 330 | 330 | 330 | 330 | 330 |
Fossil Fuels
Oil
The Port-Gentil area is where Gabon's main oil fields are located, both on-shore and off-shore[1].
| Year | 1980 | 1990 | 2000 | 2010 | 2015 | 2016 | 2017 |
|---|---|---|---|---|---|---|---|
| Reserves | 0.5 | 0.9 | 2.4 | 2 | 2 | 2 | 2 |
| Year | 1965 | 1975 | 1985 | 1995 | 2000 | 2005 | 2010 | 2015 | 2016 | 2017 |
|---|---|---|---|---|---|---|---|---|---|---|
| Produced capacity | 25 | 227 | 173 | 356 | 276 | 270 | 249 | 225 | 220 | 200 |
| Year | 2000 | 2005 | 2013 | 2014 | 2015 | 2016 | 2017 | 2018 |
|---|---|---|---|---|---|---|---|---|
| Produced Capacity | 599 | 706 | 797 | 774 | 762 | 826 | 886 | 951 |
| Final Consumption | 311 | 350 | 761 | 741 | 728 | 753 | 771 | 791 |
Key Problems of the Energy Sector
There is rarely any proper recent research papers on the challenges that the Gabonese energy sector faces currently. The only proper source that could be used for this chapter goes back to 1988, which makes its applicability questionable in 2019, but it can be found under "Gabon: Issues and Options in the Energy Sector".
Policy Framework, Laws and Regulations
Institutional Set up in the Energy Sector
Other Key Actors / Activities of Donors, Implementing Agencies, Civil Society Organisations
Further Information
References
- ↑ 1.0 1.1 1.2 1.3 1.4 1.5 1.6 1.7 1.8 1.9 Lund, H.G. & Mabirizi, F. (2017). Atlas of Africa Energy Resources. Retrieved from: https://www.icafrica.org/fileadmin/documents/Publications/Africa_Energy_Atlas.pdf
- ↑ 2.0 2.1 World Bank. (2019). The World Bank In Gabon. Retrieved from: https://www.worldbank.org/en/country/gabon/overview
- ↑ 3.0 3.1 3.2 Nachmany, M. Fankhauser, S. Davidová, J. Kingsmill, N. Landesman, T. Roppongi, H. Schleifer, P. Setzer, J. Sharman, A. Singleton, C.S. Sundaresan, J. & Townshend, T. (2015). Climate Change Legislation in Gabon: An Excerpt from the 2015 Global Climate Legislation Study – A Review of Climate Change in 99 Countries. Retrieved from: http://www.lse.ac.uk/GranthamInstitute/wp-content/uploads/2015/05/GABON.pdf Cite error: Invalid
<ref>tag; name "Nachmany, M. Fankhauser, S. Davidová, J. Kingsmill, N. Landesman, T. Roppongi, H. Schleifer, P. Setzer, J. Sharman, A. Singleton, C.S. Sundaresan, J. & Townshend, T. (2015). Climate Change Legislation in Gabon: An Excerpt from the 2015 Global Climate Legislation Study – A Review of Climate Change in 99 Countries. Retrieved from: http://www.lse.ac.uk/GranthamInstitute/wp-content/uploads/2015/05/GABON.pdf" defined multiple times with different content Cite error: Invalid<ref>tag; name "Nachmany, M. Fankhauser, S. Davidová, J. Kingsmill, N. Landesman, T. Roppongi, H. Schleifer, P. Setzer, J. Sharman, A. Singleton, C.S. Sundaresan, J. & Townshend, T. (2015). Climate Change Legislation in Gabon: An Excerpt from the 2015 Global Climate Legislation Study – A Review of Climate Change in 99 Countries. Retrieved from: http://www.lse.ac.uk/GranthamInstitute/wp-content/uploads/2015/05/GABON.pdf" defined multiple times with different content - ↑ 4.0 4.1 4.2 4.3 Central Intelligence Agency (CIA). (2019). The World Fact-book: Africa: Gabon. Retrieved from: https://www.cia.gov/library/Publications/the-world-factbook/geos/gb.html
- ↑ Tracking SDG7. (2019). Gabon. Retrieved from: https://trackingsdg7.esmap.org/country/gabon
- ↑ 6.0 6.1 6.2 6.3 6.4 African Energy Commission (AFREC). (2019). Africa Energy Database. Retrieved from: https://afrec-energy.org/Docs/En/PDF/2018/statistics_2018_afrec.pdf
- ↑ Africa Energy Portal (AEP). (2019). Retrieved from: https://africa-energy-portal.org/country/gabon
- ↑ 8.0 8.1 8.2 Whiteman, A. Esparrago, J. Rueda, S. Elsayed, S. & Arkhipove, I. (2019). Renewable Energy Statistics 2019. Retrieved from: https://www.irena.org/-/media/Files/IRENA/Agency/Publication/2019/Mar/IRENA_RE_Capacity_Statistics_2019.pdf
- ↑ 9.0 9.1 BP. (2018). BP Statistical Review of World Energy. Retrieved from: https://www.bp.com/en/global/corporate/energy-economics/statistical-review-of-world-energy/downloads.html


