SE4Jobs Toolbox - Assessment
SE4Jobs Toolbox – Laying the foundations for a sustainable development

| Existing Capacities | Co-benefits | Trade-offs |
Tools
EQuIP CADRE Interactive AILEG HELIO ELMA |
What is the issue assessment of existing capacities and potentials about? [Expand]
Strategies and policies for RE and EE should be based on the systematic analysis of existing conditions and capacities within a country, so as to maximise their potential for developing markets and employment in these sectors. It is therefore important that each country develops its own assessment capacities. Why is such an assessment important for the expansion of RE and EE? [Expand]
The socio-economic benefits of RE and EE have become increasingly prominent in political debates around the world, and there are numerous examples of countries successfully harnessing the potential of RE and EE to create new sources of income for broad segments of the population. Developing and emerging countries in particular have made strong, rapid progress in recent years. While their framework conditions, approaches and trajectories differ considerably, it is possible to identify some common factors that have contributed to their success. Leveraging each jurisdiction’s potential requires a coherent and comprehensive policy framework that mobilizes investment in the RE and EE markets. Such strategies are often difficult to develop, as they cut across political, sectoral and institutional boundaries. Moreover, they tend to be contested by vested interests related to conventional energies. Frequent arguments against policies for and investments in RE and EE include:
Job creation in the RE and EE sectors would be offset by job losses in conventional sectors or lead to opportunity costs that result in negative net effects. To counter such arguments, it is extremely important to assess the actual potential of RE and EE to create positive net effects based on local value added and employment.[1] Such assessments not only help decision-makers to justify measures to support these sectors in general; they also help to determine which aspects (technologies, parts of the value chain, etc.) are likely to produce the greatest benefits and returns on investments. When assessing existing capacities for or the potential positive effects of expanding RE/EE, it is essential to use appropriate and reliable data and methods. The next section outlines different data sources and methods that you can use to assess the socio-economic effects of expanding RE/EE, and illustrates them with successful cases of how they have been used around the world. What are key questions for addressing the issue of assessing existing capacities and potentials? [Expand]
The expansion of RE and EE has major implications for many other areas of the economy besides the energy sector. In view of this, it is important to assess countries’ natural and human potentials for developing markets for RE and EE. The following questions illustrate the range of factors that have to be taken into consideration when developing RE/EE markets and employment in your country:
How can the issue of assessing existing capacities and potentials be addressed? [Expand]
To properly address and answer these various questions, substantial information and analysis are needed. Requirements range from the kind of statistical data typically generated by statistical offices or research institutes, to market analyses by businesses or industry associations, to modelling capacities to assess how different aspects of the energy system are likely to develop and what their impacts on the broader economy will be. The availability and quality of data is likely to differ significantly, depending on the sector and relevant jurisdiction. While in most countries, data is readily available for energy consumption and production, data on value added or jobs in RE and/or EE are typically not, and must be generated. In addition to existing capacities at national or subnational level, there are many regional and international organisations that gather and share data on RE and EE, serving as a further source of information and orientation. Such sources include the annual REN21 Global Status reports, IRENA’s RE data publications[2] and its regular RE Jobs reports, the FS-UNEP reports on Global Trends in Renewable Energy Investment, as well as the IEA’s Energy Efficiency Market reports and the World Energy Council’s databank on energy efficiency indicators[3]. Other sources provide guidance and methodologies for conducting assessments (e.g. the International Labour Organisation’s publications on assessing the employment effects of RE/EE). A starting point could be to commission a comprehensive study on the potentials for RE and EE in your country, addressing the above-mentioned questions. As a next step, units in scientific agencies such as environmental agencies may build up capacities for data collection and evaluation, including economic modelling and scenario building. A key requirement for this is the availability of economic input-output tables (I/O tables). In their standard form, I/O tables reveal the sources of value creation throughout the value chain. The data can be enriched by employment figures and, from the point of view of developing a green economy, with data on emissions and resource use (physical I/O table). This allows the analysis of the jobs created along the value chain with respect to emissions and resource use. National statistical offices should provide such I/O tables and update them on a regular basis. Practical aspects of the issue and good practice examples [Expand]
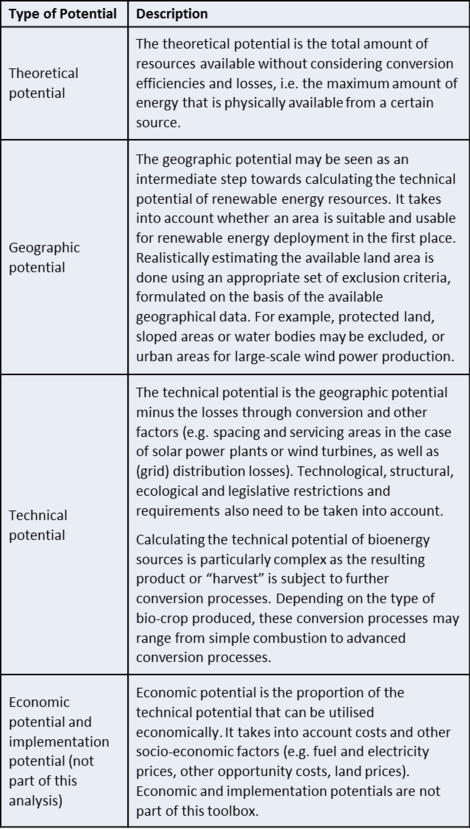
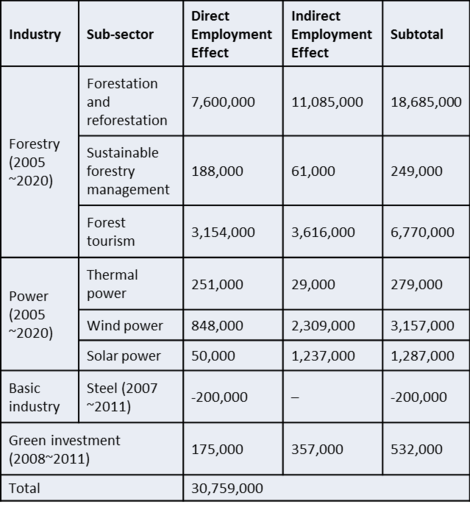
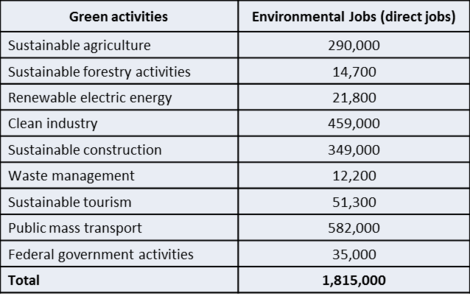
There are different aspects to consider when assessing your country’s capacities to develop markets and employment in these sectors. These are outlined below. Assessing natural conditions for RE generation Assessing the natural conditions for harvesting sun, wind, hydro, bio and geothermal energy in your country is an important first step in analysing and comparing the potential that different RE sources have for energy generation (and therefore job creation). Many different types of sources are available for estimating the occurrence and distribution of RE in a country. These range from academic papers, to government reports, to publications by international organisations. For example, the South African National Energy Development Institute, Mexico’s Energy Ministry and India’s Ministry of New and Renewable Energy all regularly issue high-quality data on their respective RE potentials[4]. Beyond these self-assessments, there are also a number of international agencies that produce quality data. For instance, IRENA has developed the Global Atlas for Renewable Energy platform[5], which integrates a large amount of assessment data for multiple RE technologies on a global scale. To correctly assess a country’s RE potential and precisely define its expected contribution, it is important to distinguish between different kinds of potentials. The table below provides a brief overview. Table: Different types of renewable energy potentials[6] Assessing the employment potential in RE/EE markets For assessing the employment potential of RE and EE, the International Labour Organisation (ILO) has developed a methodology that is particularly suited to developing countries[7]. The ILO methodology uses sectoral statistics, but also explores the share of green jobs within sectors. This method offers definitions and indicators for assessing the share of green jobs as a total of the economy and can also be applied in the context of RE and EE technologies. The textbox below shows how the methodology was used to estimate the potential employment gains from RE and EE in China and Mexico, based on input-output tables. Estimating future employment effects from RE and EE in China using input-output tables The study by the Chinese ILO Office, the Chinese Academy of Social Sciences and the Institute for Urban and Environmental Studies estimated the employment effects of the Chinese climate policy goal to reduce its carbon emissions per unit of GDP by 40% to 45% by 2020 (compared to 2005). It used input-output tables with data from eight areas (“sub-sectors”) to estimate the direct and indirect employment effects beyond employment in RE and EE. Overall, it found that low carbon development would lead to a net gain of over 30 million direct and indirect green jobs by 2020. While these green jobs would overwhelmingly lie in the forestry and green tourism sectors (nearly 26 million), over four million net green jobs would be linked to RE. EE employment effects are harder to estimate and more dispersed. The model assumes net employment gains of nearly 280,000 direct and indirect jobs[8] via EE in thermal energy generationand a gain of more than 200,000 from “green investments” in the EE of buildings[9]. However, it is important to note that such estimates are not infallible. The Chinese solar sector has grown rapidly since the study was published in 2010, leading to a situation where IRENA already estimates that there are more jobs in the solar sector today (1.64 million) than originally estimated for the year 2020. It is therefore safe to assume that the number of green jobs in the solar sector will be significantly higher than predicted by the ILO model. The study is a good practice example of how to assess the medium-term employment effects of the implementation of climate policy goals, in a way that reveals the distribution of employment effects across sectors and between direct and indirect employment. Table: Estimated direct and indirect employment effects in China[10] Measuring existing ‘green jobs’ in Mexico using input-output tables The ILO study on green jobs in Mexico assesses existing employment in Mexico’s green economy. It uses official data and input-output tables of the Mexican economy to identify nine ‘green activities’ that are used to differentiate between ‘green’ and ‘regular’ jobs (see Table below). In addition to estimating over 1.8 million direct jobs in green activities, the study calculated multiplier effects and found that these effects were higher in green sectors than in their conventional counterparts. Based on this, the study calculated that there were a further 971,000 jobs indirectly related to green activities. Finally, the study analysed a scenario (unrelated to any specific policy strategy) where selected parts of the economy transitioned to ‘green activities’. The result showed that net employment increased by over 700,000 jobs – underscoring that the greening of sectors is generally associated with higher employment intensity. This assessment is a good practice example for estimating existing ‘green’ employment using the ILO methodology for developing countries. Furthermore, the comparison of various green and non-green scenarios again demonstrated that greening the economy was likely to increase employment levels. Table: Estimated existingenvironmental-related employment in Mexico in different sectors of the economy[11] <span style="color:#336699"</span>Employment factors Employment factors offer another method for calculating employment effects. For example, they can be used to quickly estimate the gross employment effects of investments in renewable energies. Employment factors provide an estimate of the number of employees needed for a specific task (e.g. number of person-years per installed capacity or per actual production) or resulting from a specific investment in a specific part of the value chain (project development, manufacturing, construction, operation and maintenance, as well as decommissioning and recycling). Typically, renewable energies are more labour intensive, both per unit of production as well as per unit of investment compared to conventional energy technologies. It should be noted that many sources for employment factors are based on data from industrial countries. Further, employment effects differ vastly – for example, between different RE technologies and applications[12], between the different approaches to each of them, and between the different stages of the value cycle, as well as between countries, depending on the productivity of their workforce. The table below illustrates the extent to which employment factors vary between countries in the RE sector. [INSERT TABLE: Employment factor estimates for different RE technologies. Source: IRENA, 2013, p. 42. Please see the original source for references to the data sources presented in the table.] The graph below illustrates how employment factors can vary significantly between selected countries, RE technologies and stages in the value chain. It is based on an analysis of the scientific literature on the employment factors of RE technologies around the globe. Given this range, it is essential to use reality-adjusted employment factors that do not drastically over or underestimate the employment effects for any given jurisdiction. [INSERT FIGURE: Direct and indirect jobs per deployment phase (in jobs/MW) for different RE technologies based on minimum, median and maximum values for employment factors in the available literature. Source: Cameron and van der Zwaan, 2015[13]] Economic models Quantitative data can also be gathered via economic models. These can be used to compare different investment scenarios (and policies that encourage such investments) in RE and EE, as well as to assess their impact on (domestic) economic parameters such as value creation and employment. Different types of models are available and are classified according to their methodology:
Use of system dynamics model in South African green economy modelling report The T21 system dynamics model was developed on a global scale by the United Nations Environmental Programme (UNEP) for the report “Towards a Green Economy: Pathways to Sustainable Development and Poverty Eradication”. UNEP, with support from the United National Development Programme (UNDP), then applied the model to the South African economy in the “Green Economy Modelling Report of South Africa – Focus on Natural Resource Management, Agriculture, Transport and Energy Sectors” to “evaluate the impact of green economy investment on medium to long-term environmental, economic and social development issues” between 2001 and 2030[14]. The approach was developed in a workshop with UNEP and various South African government agencies. It sought to use national data as much as possible and, in areas where data was not available, it relied on the assumptions used in the global green economy report. The model compared four different scenarios – two versions of ‘business as usual’ and two versions of a ‘green investment’ scenario “assum[ing] an active government intervention in the identified four sectors in order to encourage shifts towards low carbon, resource-efficient and pro-employment development”[15]. The comparison of the four scenarios using the system-dynamics T21 model showed that the green investment scenario in which an additional 2% of GDP was invested in the green economy led to the highest employment gains in the South African economy (28.3 million jobs in 2030, compared to fewer than 28 million jobs in the BAU scenarios). The study provides an example of an advanced system dynamics model being applied to a country to estimate the medium and long-term economic and employment effects of a green economy. Its key findings support policymakers arguing for active investments to accelerate the transition to a green economy. Firm surveys Innovations, investments and markets for energy efficiency technologies are particularly hard to trace. This is because the technologies and their applications are not specific to a particular sector, and are instead widely dispersed across the economy. To gather data on innovation, investments and employment related to energy efficiency, surveys of firms are a valuable source for estimating markets, and their prospects and impacts. Report: “Decent Work in the Green Economy. Business Cases from Turkey” This ILO publication was based on a qualitative study of businesses in various sectors of the green economy in Turkey. It used semi-structured face-to-face interviews with company representatives to provide the Turkish government with information to help formulate a green jobs strategy[16]. The study is noteworthy as it is one of the few examples showing how business leaders view the challenges of creating green jobs in Turkey. The study is part of a larger cooperation project with the ILO. The study raised the profile of green jobs in the political discourse, and informed government and social partners about the practical challenges businesses face. Challenges in implementing the issue of assessing existing capacities and potentials [Expand]
Tools and methods [Expand]
PRODUSE (Module 1)
|
Good Practices
China South Africa |
Reference
- ↑ IRENA (2015c) provides a thorough overview on the methodology used in the assessment of employment effects of RE.
- ↑ http://resourceirena.irena.org/gateway/dashboard/
- ↑ https://www.wec-indicators.enerdata.eu/
- ↑ Joint SENER-IRENA report "Renewable Energy Prospects: Mexico" (2015): http://www.irena.org/DocumentDownloads/Publications/IRENA_REmap_Mexico_report_2015.pdf; and Wind Atlas of South Africa: http://www.wasaproject.info/index.html
- ↑ The Global Atlas for Renewable Energy is available at http://irena.masdar.ac.ae/
- ↑ IRENA (2014)
- ↑ ILO report "Assessing green jobs potential in developing countries: a practicioner's guide" (2011): http://www.ilo.org/wcmsp5/groups/public/---dgreports/---dcomm/---publ/documents/publication/wcms_153458.pdf
- ↑ To distinguish the two concepts of direct and indirect employment: “direct employment effects refer exclusively to effects that are brought about directly by the measure concerned, or in a selected sector (e.g. renewable energies). Indirect employment effects are those that are brought about in the upstream or downstream stages of the value chain” (Jacob, Quitzow & Bär, 2015, p. 11).
- ↑ Joint Institute for Urban and Environmental Studies-Chinese Academy of Social Sciences' Study on Low Carbon DevelopmentfckLRand Green Employment in China (2010): http://www.ilo.org/wcmsp5/groups/public/---asia/---ro-bangkok/---ilo-beijing/documents/publication/wcms_155390.pdf
- ↑ Institute for Urban and Environmental Studies,Chinese Academy of Social Sciences (2010)
- ↑ ILO (2013)
- ↑ There are, for example, considerable disparities in the number of person-years of employment in solar PV, depending on whether it is large-scale, ground-mounted PV or distributed rooftop PV.
- ↑ “O&M” stands for the operation and maintenance of RE technologies.
- ↑ UNEP (2013), p. 20: http://www.unep.org/greeneconomy/portals/88/Modelling%20Report%20SA/SAModellingReport.pdf
- ↑ UNEP (2013), p. 28: http://www.unep.org/greeneconomy/portals/88/Modelling%20Report%20SA/SAModellingReport.pdf
- ↑ ILO's "Decent Work in the Green Economy: Business Cases from Turkey" (2015): http://www.ilo.org/wcmsp5/groups/public/---ed_emp/---emp_ent/documents/publication/wcms_375698.pdf
|
This article is part of the RE-ACTIVATE project. RE-ACTIVATE “Promoting Employment through Renewable Energy and Energy Efficiency in the MENA Region” is implemented by the Deutsche Gesellschaft für Internationale Zusammenarbeit (GIZ) GmbH on behalf of the German Ministry for Economic Cooperation and Development (BMZ). |


