Click here to register!
Nigeria Electricity Sector
This article is written by Charlotte Remteng, Muhammad Bello Suleiman, Chiamaka Maureen Asoegwu and Chysom Nnaemeka Emenyonu as part of the requirements for the Open Africa Power Fellowship Programme 2021. It is a sub-section of the publication, Country Project Nigeria.
Evolution and present situation of power system
Energy Supply
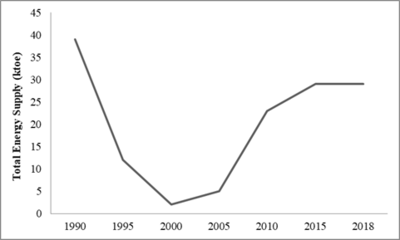
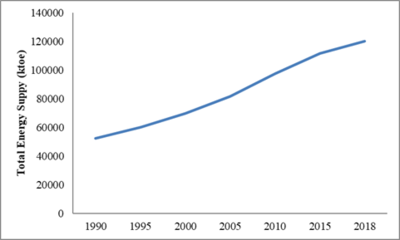
Fossil fuels: coal, oil, and natural gas have been the principal sources of energy in Nigeria.The trends in the total energy supply for coal from 1990 to 2018 are shown. By 1990, there was a steep decline until 2000. An increase in the use of coal is seen from 2000 till 2015 till about 2018 when it fell slightly (Figure 3). Coal was discovered in Nigeria in 1909 in Enugu, eastern Nigeria, with early production dating back to 1916. About 24,500 tonnes of coal was produced and used for mass (railway) transportation, which increased electricity generation, and industrial activities.
Today, 80% of power generation comes from gas; most of the remainder comes from oil, with Nigeria being the largest user of oil-fired backup generators on the continent. Natural gas remains the main source of power in the AC, although there is a shift towards solar PV as the country starts to exploit its large solar potential (IEA, 2019).
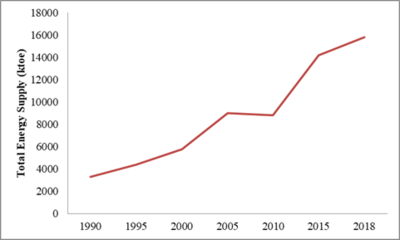
Figure 4 below shows the increase in the Total Energy Supply (TES) for Natural gas, where there is a gradual increase up until 2005 where there was a slight fall with a spiky increase from 2010 till 2018.
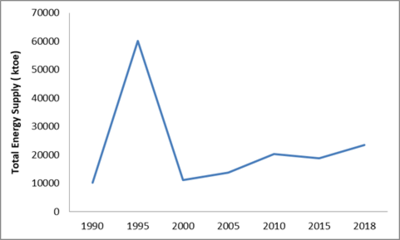
Oil production spikes from 1990 to 1994, and from 1995, there was a drastic drops with slight increases over the years as shown in figure 5 below.
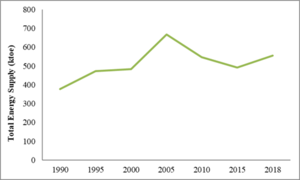
Total energy supply from Hydro on the other hand increased for over a decade (1990-2000), with sharp increase between 2000 and 2005, followed by falls till 2015 when TES from hydro increase from about 450 to 550 ktoe (Figure 6).
The total supply from Biofuel and Wastes increased almost steadily from 1990-2018 as shown on Figure 7.
Generation, Transmission, and Distribution
Generation
According to the Nigerian Electricity Regulation Commission (NERC), electricity generation started in Nigeria in 1896 but the first electric utility company, known as the Nigerian Electricity Supply Company, was established in 1929.
The first Nigerian electrical power plant was built in 1896 comprising of a 30kw, 1000v, 80cycle, single-phase supply, with an additional unit installed in 1902, and by 1909, installed capacity had reached 120KW with a registered energy demand of 65KW (Edomah et al., 2016). In 1920, the installed capacity for the Lagos Marina power station was 420 kW. The first coal-fired power plant was built and commissioned on 1 June 1923 with a total installed capacity of 3.6 MW and a 3-phase, 4-wire, 50-cycle system adopted in 1924 (Edomah et al., 2016) with a shutdown of the Marina site on 28 November 1923. The new power station further grew in installed capacity to 13.75 MW. Despite this growth, between 1944 and 1948, Nigeria started experiencing a decline in the use of coal for electricity generation as a result of reduced mining activities, as well as the small discoveries of crude oil to the large scale discovery of oil in Nigeria in 1956. Due to frequent outrages, the Niger Dams Authority (NDA) under whose scheme three hydro and three thermal generating plants were constructed (Davidson et al., 2001). An increase in Nigeria's total population was not marked by a consequent increase in available power. Subsequently, in 1988, available power was increased to 1273 MW. By 1992 population had increased to about 80 million however, the total available power was 3,000 MW (Sule, 2010).
In the 1990s the Nigerian electricity system was failing to meet Nigeria's power needs, leading to the National Electric Power Policy of 2001, and several other reforms (KPMG, 2016). By the year 2000, a state-owned monopoly, the National Electric Power Authority (NEPA), was in charge of the generation, transmission, and distribution of electric power in Nigeria. It operated as a vertically integrated utility company and had a total generation capacity of about 6, 200 MW from 2 hydro and 4 thermal power plants. This resulted in an unstable and unreliable electric power supply situation in the country with customers exposed to frequent power cuts and a long period of power outages and an industry characterized by lack of maintenance of power infrastructure, outdated power plants, low revenues, high losses, power theft, and non-cost reflective tariffs.
By 2001, the Independent Power Producers (IPPs) and National Integrated Power Projects (NIPP) were established to remedy the power shortage situation. In 2005, Nigeria had an estimated 6,861 MW of installed electricity generating capacity (Babatunde and Shauibu, 2011).
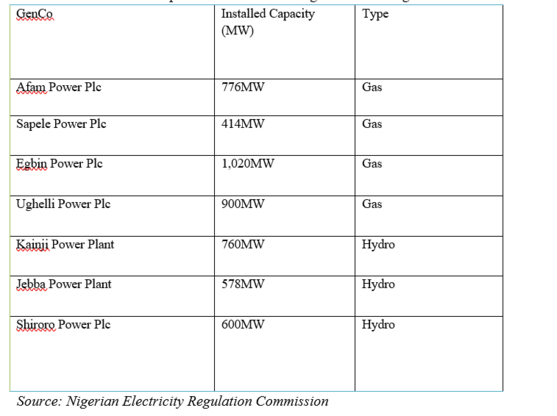
Nigeria’s energy transformation was marked by vertical unbundling of Nigeria’s power sector resulted in 6 generating companies and IPPs which are jointly referred to as Gencos. The transformation started with the establishment of the Electricity Cooperation of Nigeria (ECN) in 1951 and the Niger Dam Authority (NDA) in 1962. The ECN and NDA were merged through Degree 24 of 1972 to form the Nigerian Electric Power Authority (NEPA), later called Power Holding Company of Nigeria (PHCN). In the year 2001, the reform of the electricity sector began with the promulgation of the National Electric Power Policy which had as its goal the establishment of an efficient electricity market in Nigeria. It had the overall objective of transferring the ownership and management of the infrastructure and assets of the electricity industry to the private sector with the consequent creation of all the necessary structures required to forming and sustain an electricity market in Nigeria.
In 2005 the Electric Power Sector Reform (EPSR) Act was enacted and the Nigerian Electricity Regulatory Commission (NERC) was established as an independent regulatory body for the electricity industry in Nigeria. In addition, the Power Holding Company of Nigeria (PHCN) was formed as a transitional corporation that comprises of the 18 successor companies (6 generation companies, 11 distribution companies, and 1 transmission company) created from NEPA (See Table 2 below). In 2005, the total site rating of installed capacities at all Power Holding Company of Nigeria (PHCN) power stations was 6656.40MW but with an average available capacity of 3736.55MW, hence having a percentage availability of 56.13%. In July 2009 the total installed generation capacity of the PHCN plant was 9,914.4MW while 1,115.MW was from IPPs (Onuoha. K, 2010; Buraimoh. E et al. 2017).
Table 2: Generation Companies Created following the unbundling of PHCN
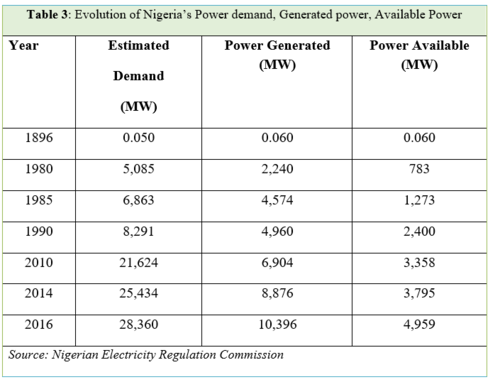
In 2O10, the Nigerian Bulk Electricity Trading Plc (NBET) was established as a credible off-taker of electric power from generation companies. By November 2013, the privatization of all generations was complete. Also, By July 2014, the total installed capacity of generating plants increased to 8,876 MW but with an available capacity of about 3,795MW.
There are currently 23 grid-connected generating plants in operation in the Nigerian Electricity Supply Industry (NESI) with a total installed capacity of 11,165.4 MW and an available capacity of 7,139.6 MW. Most generation is thermal-based, with an installed capacity of 9,044 MW (81% of the total) and an available capacity of 6,079.6 MW (83% of the total). Hydropower from three major plants accounts for 1,938.4 MW of total installed capacity (and an available capacity of 1,060 MW).
Actual electricity supply has been significantly less than load demand, for instance in 2014 and 2016, the actual supply lagged behind the power demand by 21,639MW and 23,401MW respectively, representing about 15% and 17% of power availability. Thus, there is no corresponding increase in electricity generation as population increase as shown in 2014 where country's population increased to 165 million but the total available power generated stood at 3795MW (Babatunde and Shauibu, 2011).
Currently, Nigeria is one of the most underpowered countries in the world, with actual consumption 80% below expectations based on current population and income levels. Self-generation in Nigeria is extremely prevalent; nearly 14GW capacity exists in small-scale diesel and petrol generators, and nearly half of all electricity consumed is self-generated implying a huge unserved demand. Given this, we can assume that Nigeria's demand gap is significant, though exactly how large is disputed. The significant differences in these estimates demonstrate the difficulty, and importance, of accurate demand forecasting (See table 3 below)
This makes a large segment of Nigerians rely on alternative sources of power using mostly fossil fuel (both centralized large-scale and small diesel generators) which contribute significantly to carbon footprints.
Transmission and Distribution
Power transmission started in Nigeria with the interconnection of power stations in Kainji, Jebba, Shiroro, Afam, Delta (Ughelli), Sapele (Ogorode), and Egbin (Lagos) during the first half of the 1960s. During this era, the 330 kV transmission network increased to twenty-eight buses and thirty-two transmission lines (Omorogiuwa E et al. 2012) The existing transmission lines increased from thirty-two (32) to sixty-four (64) and buses from twenty-eight (28) to fifty-two (52) between 1998 and 2012. The grid interconnects these stations with fifty-two buses and sixty-four transmission lines of lines and has four control centers (one national control center at Oshogbo and three supplementary control centers at Benin, Shiroro, and Egbin). Transmission Company of Nigeria (TCN) manages the electricity transmission network in the country. It is one of the 18 companies that was unbundled from the defunct Power Holding Company of Nigeria (PHCN) in April 2004 and is a product of a merger of the transmission and system operations parts of PHCN. It was incorporated in November 2005 and issued a transmission license on July 1, 2006. TCN is presently fully owned and operated by the government and as part of the reform program of the government, it is to be re-organized and restructured to improve its reliability and expand its capacity.
Currently, the transmission system is made up of about 5,523.8 km of 330 kV lines, 6,801.49 km of 132 kV lines, and 24,000km of sub-transmission lines (33kV) (KPMG, 2016). The power distribution network is presently made up of 19,000Km of 11kV lines and about 22,500 Substations. Currently, 11 electricity distribution companies are covering the entire country
By 2013, the privatization of 10 distribution companies was completed with the Federal Government retaining the ownership of the transmission company. The privatization of the 11th distribution company was completed in November 2014. There are currently 11 Electricity Distribution Companies (DisCos) in Nigeria.

