Nigeria Electricity Sector
This article is written by Charlotte Remteng, Muhammad Bello Suleiman, Chiamaka Maureen Asoegwu and Chysom Nnaemeka Emenyonu as part of the requirements for the Open Africa Power Fellowship Programme 2021. It is a sub-section of the publication, Country Project Nigeria.
Nigeria Energy Situation
- Introduction
- Policy and regulatory framework
- Clean cooking in Nigeria
- Specific regulation and business models for each electrification mode, cooking, and other energy access-related activities. Successes and shortcomings
- Existing major energy projects in Nigeria
- Key challenges in Nigeria's energy sector
Evolution and present situation of power system
Energy Supply
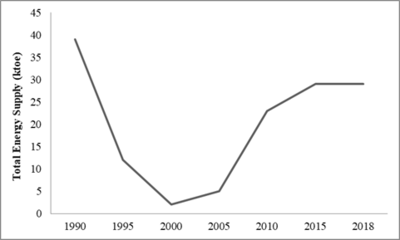
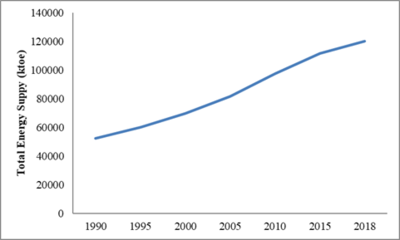
Fossil fuels: coal, oil, and natural gas have been the principal sources of energy in Nigeria.The trends in the total energy supply for coal from 1990 to 2018 are shown. By 1990, there was a steep decline until 2000. An increase in the use of coal is seen from 2000 till 2015 till about 2018 when it fell slightly (Figure 3). Coal was discovered in Nigeria in 1909 in Enugu, eastern Nigeria, with early production dating back to 1916. About 24,500 tonnes of coal was produced and used for mass (railway) transportation, which increased electricity generation, and industrial activities.
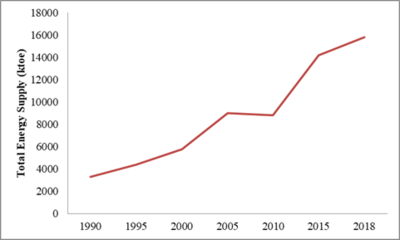
Today, 80% of power generation comes from gas; most of the remainder comes from oil, with Nigeria being the largest user of oil-fired backup generators on the continent. Natural gas remains the main source of power in the AC, although there is a shift towards solar PV as the country starts to exploit its large solar potential (IEA, 2019).
Figure 4 below shows the increase in the Total Energy Supply (TES) for Natural gas, where there is a gradual increase up until 2005 where there was a slight fall with a spiky increase from 2010 till 2018.
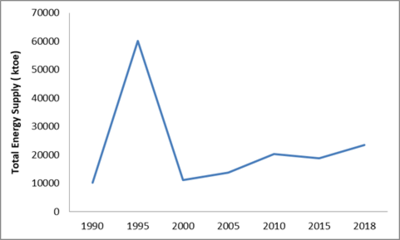
Oil production spikes from 1990 to 1994, and from 1995, there was a drastic drops with slight increases over the years as shown in figure 5 below.
Total energy supply from Hydro on the other hand increased for over a decade (1990-2000), with sharp increase between 2000 and 2005, followed by falls till 2015 when TES from hydro increase from about 450 to 550 ktoe (Figure 6).
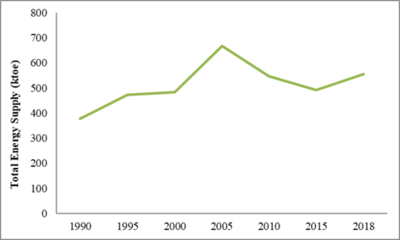
The total supply from Biofuel and Wastes increased almost steadily from 1990-2018 as shown on Figure 7.
Generation, Transmission, and Distribution
Generation
According to the Nigerian Electricity Regulation Commission (NERC), electricity generation started in Nigeria in 1896 but the first electric utility company, known as the Nigerian Electricity Supply Company, was established in 1929.
The first Nigerian electrical power plant was built in 1896 comprising of a 30kw, 1000v, 80cycle, single-phase supply, with an additional unit installed in 1902, and by 1909, installed capacity had reached 120KW with a registered energy demand of 65KW (Edomah et al., 2016). In 1920, the installed capacity for the Lagos Marina power station was 420 kW. The first coal-fired power plant was built and commissioned on 1 June 1923 with a total installed capacity of 3.6 MW and a 3-phase, 4-wire, 50-cycle system adopted in 1924 (Edomah et al., 2016) with a shutdown of the Marina site on 28 November 1923. The new power station further grew in installed capacity to 13.75 MW. Despite this growth, between 1944 and 1948, Nigeria started experiencing a decline in the use of coal for electricity generation as a result of reduced mining activities, as well as the small discoveries of crude oil to the large scale discovery of oil in Nigeria in 1956. Due to frequent outrages, the Niger Dams Authority (NDA) under whose scheme three hydro and three thermal generating plants were constructed (Davidson et al., 2001). An increase in Nigeria's total population was not marked by a consequent increase in available power. Subsequently, in 1988, available power was increased to 1273 MW. By 1992 population had increased to about 80 million however, the total available power was 3,000 MW (Sule, 2010).
In the 1990s the Nigerian electricity system was failing to meet Nigeria's power needs, leading to the National Electric Power Policy of 2001, and several other reforms (KPMG, 2016). By the year 2000, a state-owned monopoly, the National Electric Power Authority (NEPA), was in charge of the generation, transmission, and distribution of electric power in Nigeria. It operated as a vertically integrated utility company and had a total generation capacity of about 6, 200 MW from 2 hydro and 4 thermal power plants. This resulted in an unstable and unreliable electric power supply situation in the country with customers exposed to frequent power cuts and a long period of power outages and an industry characterized by lack of maintenance of power infrastructure, outdated power plants, low revenues, high losses, power theft, and non-cost reflective tariffs.
By 2001, the Independent Power Producers (IPPs) and National Integrated Power Projects (NIPP) were established to remedy the power shortage situation. In 2005, Nigeria had an estimated 6,861 MW of installed electricity generating capacity (Babatunde and Shauibu, 2011).
Nigeria’s energy transformation was marked by vertical unbundling of Nigeria’s power sector resulted in 6 generating companies and IPPs which are jointly referred to as Gencos. The transformation started with the establishment of the Electricity Cooperation of Nigeria (ECN) in 1951 and the Niger Dam Authority (NDA) in 1962. The ECN and NDA were merged through Degree 24 of 1972 to form the Nigerian Electric Power Authority (NEPA), later called Power Holding Company of Nigeria (PHCN). In the year 2001, the reform of the electricity sector began with the promulgation of the National Electric Power Policy which had as its goal the establishment of an efficient electricity market in Nigeria. It had the overall objective of transferring the ownership and management of the infrastructure and assets of the electricity industry to the private sector with the consequent creation of all the necessary structures required to forming and sustain an electricity market in Nigeria.
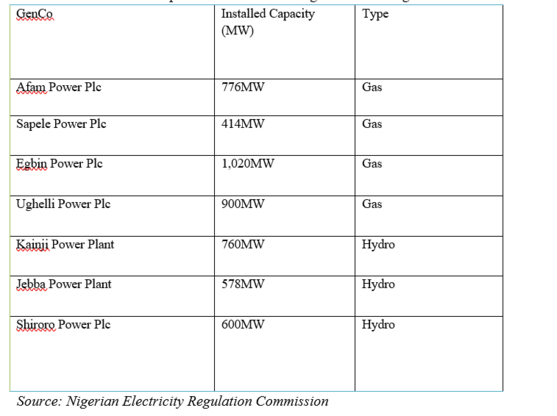
In 2005 the Electric Power Sector Reform (EPSR) Act was enacted and the Nigerian Electricity Regulatory Commission (NERC) was established as an independent regulatory body for the electricity industry in Nigeria. In addition, the Power Holding Company of Nigeria (PHCN) was formed as a transitional corporation that comprises of the 18 successor companies (6 generation companies, 11 distribution companies, and 1 transmission company) created from NEPA (See Table 2 below). In 2005, the total site rating of installed capacities at all Power Holding Company of Nigeria (PHCN) power stations was 6656.40MW but with an average available capacity of 3736.55MW, hence having a percentage availability of 56.13%. In July 2009 the total installed generation capacity of the PHCN plant was 9,914.4MW while 1,115.MW was from IPPs (Onuoha. K, 2010; Buraimoh. E et al. 2017).
Table 2: Generation Companies Created following the unbundling of PHCN
In 2O10, the Nigerian Bulk Electricity Trading Plc (NBET) was established as a credible off-taker of electric power from generation companies. By November 2013, the privatization of all generations was complete. Also, By July 2014, the total installed capacity of generating plants increased to 8,876 MW but with an available capacity of about 3,795MW.
There are currently 23 grid-connected generating plants in operation in the Nigerian Electricity Supply Industry (NESI) with a total installed capacity of 11,165.4 MW and an available capacity of 7,139.6 MW. Most generation is thermal-based, with an installed capacity of 9,044 MW (81% of the total) and an available capacity of 6,079.6 MW (83% of the total). Hydropower from three major plants accounts for 1,938.4 MW of total installed capacity (and an available capacity of 1,060 MW).
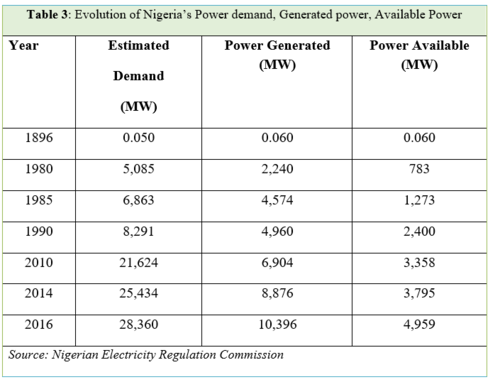
Actual electricity supply has been significantly less than load demand, for instance in 2014 and 2016, the actual supply lagged behind the power demand by 21,639MW and 23,401MW respectively, representing about 15% and 17% of power availability. Thus, there is no corresponding increase in electricity generation as population increase as shown in 2014 where country's population increased to 165 million but the total available power generated stood at 3,795MW (Babatunde and Shauibu, 2011).
Currently, Nigeria is one of the most underpowered countries in the world, with actual consumption 80% below expectations based on current population and income levels. Self-generation in Nigeria is extremely prevalent; nearly 14GW capacity exists in small-scale diesel and petrol generators, and nearly half of all electricity consumed is self-generated implying a huge unserved demand. Given this, we can assume that Nigeria's demand gap is significant, though exactly how large is disputed. The significant differences in these estimates demonstrate the difficulty, and importance, of accurate demand forecasting (See table 3 below)
This makes a large segment of Nigerians rely on alternative sources of power using mostly fossil fuel (both centralized large-scale and small diesel generators) which contribute significantly to carbon footprints.
Transmission and Distribution
Power transmission started in Nigeria with the interconnection of power stations in Kainji, Jebba, Shiroro, Afam, Delta (Ughelli), Sapele (Ogorode), and Egbin (Lagos) during the first half of the 1960s. During this era, the 330 kV transmission network increased to twenty-eight buses and thirty-two transmission lines (Omorogiuwa E et al. 2012) The existing transmission lines increased from thirty-two (32) to sixty-four (64) and buses from twenty-eight (28) to fifty-two (52) between 1998 and 2012. The grid interconnects these stations with fifty-two buses and sixty-four transmission lines of lines and has four control centers (one national control center at Oshogbo and three supplementary control centers at Benin, Shiroro, and Egbin). Transmission Company of Nigeria (TCN) manages the electricity transmission network in the country. It is one of the 18 companies that was unbundled from the defunct Power Holding Company of Nigeria (PHCN) in April 2004 and is a product of a merger of the transmission and system operations parts of PHCN. It was incorporated in November 2005 and issued a transmission license on July 1, 2006. TCN is presently fully owned and operated by the government and as part of the reform program of the government, it is to be re-organized and restructured to improve its reliability and expand its capacity.
Currently, the transmission system is made up of about 5,523.8 km of 330 kV lines, 6,801.49 km of 132 kV lines, and 24,000km of sub-transmission lines (33kV) (KPMG, 2016). The power distribution network is presently made up of 19,000Km of 11kV lines and about 22,500 Substations. Currently, 11 electricity distribution companies are covering the entire country.
By 2013, the privatization of 10 distribution companies was completed with the Federal Government retaining the ownership of the transmission company. The privatization of the 11th distribution company was completed in November 2014. There are currently 11 Electricity Distribution Companies (DisCos) in Nigeria.
Review of current components and activities of the power system: physical and functional description. Regulatory aspects corresponding to each activity.
Electricity access
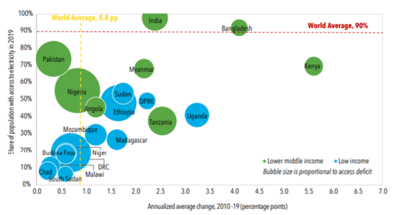
The World Energy Outlook 2020 database (IEA, 2020) as published by the International Energy Agency (IEA) placed electricity access in Nigeria at 61.6% as of 2019, with 77 million people without power supply. The country has a total population estimated at 195 million. Of this number, 51% live in urban areas while 49% live in rural areas. Electricity access for the urban population was placed at 91.4%, while that of the rural population was placed at 30.4%, an approximately 6-point decline from 36% recorded in 2018.
Nonetheless, past progress has been reversed due to the Covid-19 pandemic. This is not limited to Nigeria alone. In sub-Saharan Africa, the number of people without access to electricity increased in 2020, stifling the progress represented by the steady decline recorded since 2013 and pushing many countries farther away from achieving the goal of universal access by 2030 (IEA, 2020). According to the Tracking SDG7: The Energy Progress Report 2021(World Bank, 2021) published by The World Bank (WB), the IEA, the International Renewable Energy Agency (IRENA), the United Nations (UN), and the World Health Organization (WHO), Nigeria was ranked as the world's worst country with regards to access to electricity with about 90 million of the total population without power supply. This number corresponds to about 46% of the total population. Where the grid is available, which corresponds to 55% of the total population, consumers experience frequent power cuts ranging from 4 to 15 hours per day. This represents a huge gap that Nigerians fill with other, often less clean, and more expensive stop-gap measures. According to The Rural Electrification Agency (REA) of Nigeria, Nigerians and their businesses spend almost $14 billion (₦5trillion) annually on an inefficient generation that is expensive ($0.40/kWh or more), of poor quality power, noisy, and polluting. According to the International Energy Agency (IEA), 40TWh of power was generated from 40GW of backup generating capacity in sub-Saharan Africa in 2018, which is equivalent to 8% of electricity generation. Nigeria accounted for almost half, generating 18TWh of power from about 9GW of backup generation (IEA, 2019).
The Nigerian government has set three important and somewhat ambitious targets for its electricity sector by 2030 given the current realities. These three targets are related to access to electricity, renewable energy development, and emissions reduction. With regards to access to electricity for all, the country has a target of 90% of the population inclusive of those in rural and urban areas, having access to electricity (Henrich, B.S, 2019).
Installed generation capacity and electricity generation mix
Nigeria has the largest population and largest economy in sub-Saharan Africa but suffers from limitations in the power sector which constrains the economic growth of the country. Nigeria is endowed with large oil, gas, hydro, and solar resources, and has the potential to generate 12,522MW of electric power from existing plants, not including off-grid generation (USAID). On most days, however, it is only able to dispatch around 4,000MW, which is insufficient for a country of over 195 million people.
Main sources
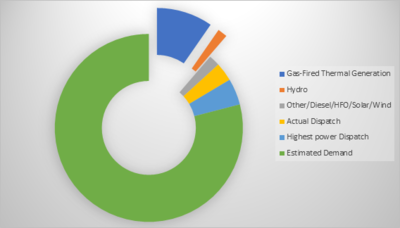
Nigeria has a total installed power generation capacity of 16,384MW. Power generation in Nigeria is mainly from hydro and gas-fired thermal power plants, with the hydro plants providing 2,062MW and the gas-fired 11,972MW (Figure 9). Solar, wind, and other sources such as diesel and Heavy Fuel Oil (HFO) constitute the remainder with 2,350MW (USAID, 2021).
Despite the figures above, Nigeria continues to struggle in dispatching at full capacity. On the 28th of February, 2021, the country recorded the highest ever dispatch power of 5,615.40MW, which was 22MW higher than, and came just three days after the previous peak of 5,593.40MW was recorded (The Guardian news, Nigeria). This is very dismal for a country with an estimated energy demand of more than 98,000MW (Nigerian Energy Report, 2019).
Renewable Energy
Challenges such as insufficient gas and grid infrastructure have hindered the growth of the traditional power sector and have necessitated the need to move beyond gas-fired power plants to the utilization of renewable energy, and supplement on-grid power with off-grid renewable solutions.
Nigeria is a signatory to the Paris Agreement, having submitted its Intended Nationally Determined Contributions on the 28th of November, 2015, signed the agreement on the 22nd of September, 2016, and ratified the agreement on the 16th of May, 2017. The NDC Sectoral Action Plan was developed and then validated in July 2018 prioritizing five major sectors - agriculture, industry, power, transport, and oil and gas; with the Department of Climate Change, Federal Ministry of Environment being the agency to drive national implementation.
Nigeria’s greenhouse gas (GHG) emissions are projected to grow 114% to around 900 million tonnes by 2030, but its NDC aligned to the country’s development policy targets a 20% unconditional and 45% conditional emission reduction below Business as Usual (BAU) by 2030.
Consequently, the Nigerian government has set a capacity expansion target of 30 GW installed on-grid capacity by 2030 with grid-connected renewable energy contributing 13.8 GW (45% of generation) with the inclusion of medium and large hydropower, and 9.1GW (30% of generation) when excluding them.
Solar
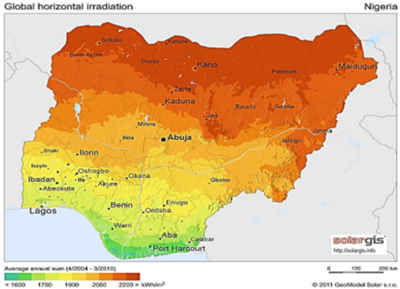
According to the Nigerian Meteorological Agency (NIMET), Africa's biggest economy is endowed with annual daily sunshine that averages 6.25 hours (Nigerian Energy Report, 2019). Nigeria is one of the tropical countries of the world which lies between 40 and 130 with a landmass of 9.24 × 10⁵ km2 enjoys average daily sunshine hours, ranging from 3.l5 hours at the coastal areas to 9.0 hours at the northern boundary. Nigeria receives about 4.851 × 10¹² kWh of energy per day from the sun (Awogbemi, O. and Komolafe, C.A. 2011).
Based on the land area of the country and an average of 5.535 kWh/m2/day, Nigeria has an average of 1.804 × 10¹⁵ kWh of incident solar energy annually. This annual solar energy insolation value is about 27 times the nation’s total conventional energy resources in energy units. This means Nigeria has boundless opportunities to tap from the power of the sun for energy (Awogbemi, O. and Komolafe, C.A. 2011). Figure 10 shows the Solar Irradiation Potential of Nigeria.
According to IRENA, Nigeria boasted approximately 28 MW of cumulative installed capacity in 2019. This is in keeping with the upward trend in the Country’s solar installed capacity from the 15MW recorded in 2012 and 19MW in 2018 (Solar Report of Nigeria, 2021). The Renewable Energy Master plan targets 500MW installed capacity for solar PV in 2025. The assumed potential for concentrated solar power and photovoltaic generation is around 427,000MW.
At the end of 2019, Nigeria's estimated installed mini-grid capacity was about 2.8MW, with 59 projects serving rural consumers. These figures have since changed with more solar mini-grids installed so far in 2020. The Commercial and Industrial solar market is also on the rise as more companies and businesses adopt the technology to power their operations. However, the market is dominated by small solar and solar home systems.
Hydro
Nigeria is bestowed with large rivers and natural falls, and an estimated 1,800 m3 per capita per year of renewable water resources available. The main water resources that provide rich hydropower potential are the Niger River, Benue River, and the Lake Chad basin (Hydropower Status Report, 2018).
Currently, the total installed capacity of hydropower is 2,062MW. Furthermore, research estimates put the total exploitable potential of hydropower at over 14,120 MW (Hydropower Status Report, 2018), amounting to more than 50,800 GWh of electricity annually. Hence, there is still an exploitable gap of roughly 85% of potential hydropower yet to be developed.
Nigeria had envisioned growing its economy at a rate of 11 to 13 percent to be among the 20 largest economies in the world by 2020. In keeping with this goal, hydropower development targets of 6,156MW and 12,801MW were set for 2020 and 2030, respectively.
Additionally, the Ministry of Power and Ministry of Water Resources established a partnership that is targeted towards rehabilitating several existing hydropower plants. These plants include the Gurara 1 (30MW), the Tiga (10MW), Oyan (10MW), the Challawa (8MW), and the 6MW Ikere plant, not leaving out the 700MW Zungeru and 40MW Kashimbila hydropower plants currently under construction (Hydropower Status Report, 2018)
Nigeria has six hydropower stations although not all of them are fully operational. Three major plants are in operation – Kainji (760MW), Jebba (578MW), Shiroro (600MW). There is also the Mambilla Power project which is expected to have an installed capacity of 3,050 MW when completed (Techcabal, 2018)..
Wind
The current installed but yet-to-be commissioned capacity of wind generation stands at 10MW. The plant is located in Katsina State, was completed in early 2021. According to the ECOWAS Observatory for Renewable Energy and Energy Efficiency, the Katsina Wind Farm would consist of 37 GEV MP 275kW, in northern Nigeria (Esi-africa, 2021). The completion of the project which began in 2005 represents a positive step forward in the wind energy space in Nigeria.
Biomass
Nigeria has a substantial biomass potential of about 144 million tonnes per year (The Nation, 2019). According to the U.S. Energy Information Administration, most Nigerians, especially rural dwellers, use biomass and waste from wood, charcoal, and animal dung, to meet their energy needs. Biomass accounts for about 80% of the total primary energy consumed in Nigeria. Most of these go towards heating, lighting, and cooking in rural areas.
In November 2016, the Ebonyi State Government took over the United Nations Industrial Development Organisation (UNIDO) demonstration biomass gasifier power plant located at the UNIDO Mini-industrial cluster in Ekwashi Ngbo in Ohaukwu Local Government Area of the State. The power plant is to generate 5.5 Megawatt energy using rice husk (BioEnergy Consult, 2021).
Geothermal
At present, there are no installed geothermal plants in Nigeria.
Off-grid
According to the REA of Nigeria, developing off-grid alternatives to complement the grid creates a $9.2B/year (₦3.2T/year) market opportunity for mini-grids and solar home systems that will save $4.4B/year (₦1.5T/year) for Nigerian homes and businesses. The agency estimates that there is a large potential for scaling considering the large swath of unserved customer population.
Currently, Solar Home Systems, Solar C&I systems, Solar Minigrids, and other off-grid gas-fired solutions dominate the off-grid space in Nigeria. As of 2019, Nigeria's total off-grid electricity generation capacity approved by the NERC was about 500MW (Rural Electrification Agency, 2019). Of this number, solar mini-grids accounted for roughly 3MW.
The policy direction and strategies of the government towards the diversification of Nigeria's energy mix and building a vibrant off-grid sector have been largely progressive. Some of these policies include the National Electric Power Policy (2001), Renewable Energy Master Plan (2005), Renewable Energy Policy Guidelines (2006), Renewable Electricity Action Programme (2006), National Renewable Energy and Energy Efficiency Policy (2015), Renewable Energy Feed-in Tariff regulations (2015 - under review), NERC Minigrid regulation of 2017, and the Eligible Customer Regulations 2017.
Other more recent legislative actions include the federal government-issued VAT (Modification Order) 2020 in which renewable energy equipment such as wind-powered generators, solar-powered generators, and solar cells, were listed as items exempted from the application of VAT.
Additionally, the NREEEP proposes free customs duty for two years on the importation of equipment and materials used in renewable energy and energy efficiency projects, and the National Renewable Energy Action Plans (2015–2030) also proposed incentives to encourage participation in the renewable energy sector. These have all contributed to the recent increase in the pace of Renewable Energy Power generation project developments in the off-grid space in Nigeria.
Regardless of these, a substantial gap exists between the policy framework and its effective implementation in enforceable laws and regulations which would need to be addressed to strengthen the framework and accelerate the deployment of renewable energy systems.
This gap is evidenced in such issues as, the cost of importing components and equipment required to develop renewable energy projects and the delay in implementation of the proposed incentives under the NREEEP such as tax holidays and credits. There are currently no tax credits for renewable energy as the Nigerian market has yet to develop sufficiently to accommodate initiatives of this kind; Accelerating the planning and implementation process will help to introduce tax credits for producers of renewable energy appliances and fixtures.
Energy project developers in Nigeria must comply with the directives of the EIA Act. There are EIA guidelines for power sector projects, including renewable energy projects, which set out the procedure for carrying out EIAs for power projects in Nigeria. However, under the current regulatory framework, renewable energy project proponents in Nigeria find the cost and applicable timelines for EIAs unfavorable. To ease the cost implications and steep timelines associated with EIAs, it would be helpful to have an affordable, and less complex process to speed up renewable energy project implementation, especially in respect of mini-grid projects.
Finally, the NERC Renewable Energy Feed-in Tariff Regulation is yet to be effective. Even if fully effective, the regulation only applies to projects with a capacity of between 1MW and 30MW, and solar projects with a capacity of 5MW and below; many off-grid renewable projects do not fall within the ambit of the Regulations. This may need to be reconsidered.
Generation
The physical aspect (technology, amount, cost, etc.),
This sector is made up of generation companies (GenCos), Independent Power Producers (IPPs), and stations under the National Integrated Power Project (NIPP), and presently includes 23 grid-connected generating plants in operation with a total installed capacity of 12,522MW. IPPs are plants owned and managed by the private sector and include the Shell-operated – Afam VI (642MW), the Agip operated – Okpai (480MW), Ibom Power, NESCO, and AES Barges (270MW)
The NIPP is an integral part of the government's effort to combat power shortages in the country. It was a government-funded initiative initiated in 2004 to add significant new generation, transmission, and distribution capacity to Nigeria's electricity supply industry along with the natural gas supply infrastructure required to deliver fuel to gas-fired plants throughout the country. There are 10 National Integrated Power Projects (NIPPs), with a combined capacity of 5,455 MW (The Nation, 2019).
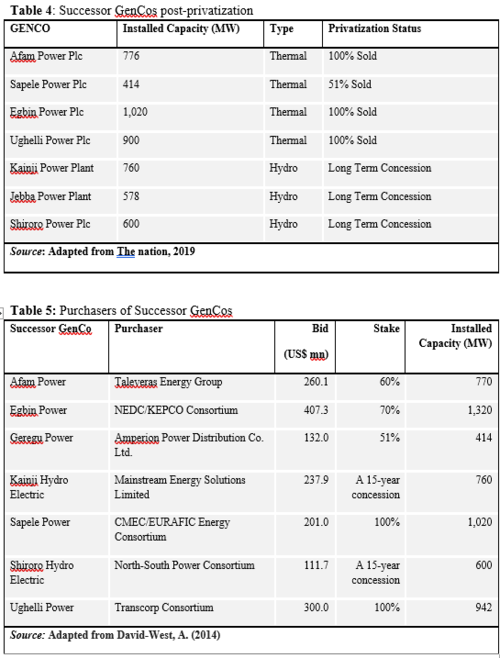
The Nigerian Power Sector privatization is reputed to be one of the boldest privatization initiatives in the global power sector over the last decade, with a transaction cost of about $3.0bn. The Federal Government of Nigeria (FGN) has been able to complete the privatization process, for the generation and distribution sectors.
Table 4 contains details about the successor GenCos:
Recently, the Bureau of Public Enterprises (BPE) put out Expression of Interest (EOI) notices to prospective investors for the purchase of 100% shareholding in any of five power generation companies under the NIPP listed for sale. The five-generation plants are Geregu Generation Company Ltd with an installed capacity of 506MW, Benin Generation Company Ltd with 507 MW, Calabar Generation Ltd with 634MW, Omotosho Generation Ltd with 513MW, and Olorunsogo Generation Company Ltd with 754MW (David-West. A, 2014).
The functional and Regulatory aspects
To carry out business as an entity in the Nigerian Electricity Supply Industry (NESI), the entity must obtain the appropriate license from the Nigerian Electricity Regulatory Commission (NERC). All GenCos are issued generation licenses from the regulator.
The generation license authorizes the licensee to construct, own, operate and maintain a generation station for purposes of generation and supply of electricity and ancillary services per the Electric Power Sector Reform Act (EPSRA), 2005. This license is required for any power generation activity beyond 1MW.
Transmission network
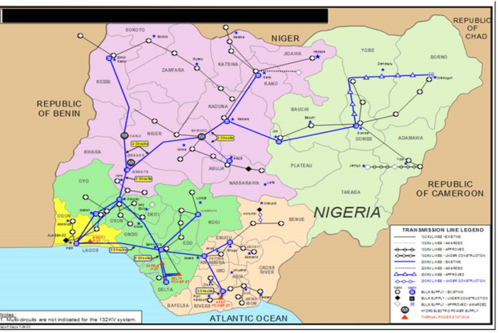
The Transmission Company of Nigeria (TCN) manages the electricity transmission network in the country. TCN is presently fully owned and operated by the government and licensed activities include electricity transmission, system operation, and GenCos and wheeling it to the DisCos.
Figure 11 below shows the transmission network of Nigeria
The physical aspect (technology, amount, cost, etc.),
Nigeria's transmission network consists of high voltage substations with a total (theoretical) transmission wheeling capacity of 7,500MW and over 20,000km of transmission lines. Currently, transmission wheeling capacity (5,300MW) is higher than the average operational generation capacity of 3,879MW but it is far below the total installed generation capacity of 12,522MW. The entire infrastructure is essentially radial, without redundancies thus creating inherent reliability issues (NERC, 2015)
The functional aspects
The TCN is made up of three operating departments:
Transmission Service Provider – oversees the development, maintenance, and expansion of the transmission infrastructure. It is responsible for the national inter-connected transmission system of substations and power lines and providing open access transmission services.
System Operations – manages the flow of electricity throughout the power system from generation to distribution companies. This department’s functions include power allocation, Grid Code administration, voltage and frequency control, economic dispatch of generation units, ancillary services management, among others.
Market Operations - administers the market rules of the NESI. It is responsible for the administration of the Electricity Market and promoting efficiency in the market.
The Regulatory and Business Aspects
The NERC established the Transmission Use of System (TUOS) charge, which is uniform, regulated, and paid to the Transmission Company of Nigeria (TCN) monthly by electricity distribution companies from generators to the local bulk supply point(s) of the companies. The TUOS is determined using the building blocks methodology by bringing together existing and forecast capital costs, efficient operating costs, and allowances for return on capital and depreciation (https://nerc.gov.ng/index.php/home/nesi/404-transmission )
A transmission license authorizes the licensee to carry on grid construction, operation, and maintenance of transmission system within Nigeria, or that connects Nigeria with a neighboring jurisdiction, limited to the activities specified in the license issued.
Distribution and Retail
The physical aspect (technology, amount, cost, etc.),
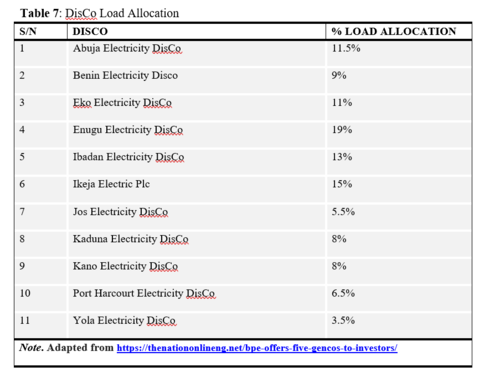
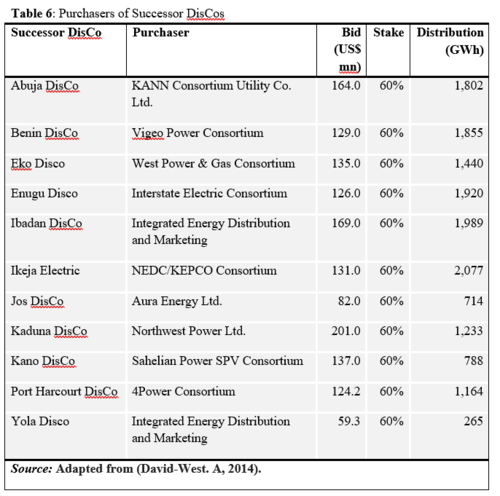
Eleven (11) Electricity DisCos were created from the power sector privatization process in Nigeria. While the FGN fully divested its interest in all the GenCos, 60% of its shares in the eleven (11) DisCos were sold to the private operators, raising US$1.46 billion.
The functional aspects
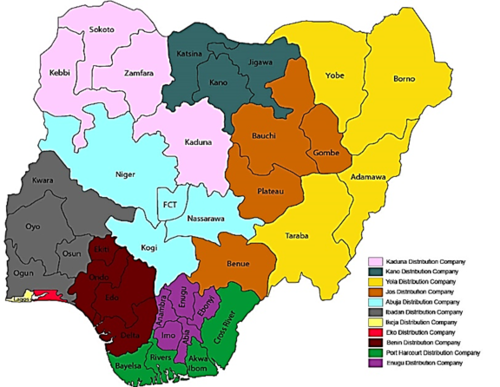
The coverage areas of the companies are shown below in figure 12
The regulatory aspects plus the business model of this activity.
The NERC ensures that prices are cost-reflective, losses are reduced, and as little as possible of the costs of such losses are passed on to customers. Tariffs are determined using the Multi-Year Tariff Order (MYTO) methodology based on the building blocks approach. The prices are designed to the costs of electricity (energy & capacity), transmission use of system cost, regulatory and market administration charges, the Discos' distribution charges, and costs associated with metering, billing, marketing, and revenue collection. Under the new system, each DisCo has its tariff.
Each DisCo has a distribution license that authorizes it to construct, operate and maintain distribution systems and facilities, including, but not limited to, the connection of customers to receive electricity.
In the off-grid space, tariffs models are usually agreed upon between the power service provider and the customer or off-taker. Most mini-grids use a subscription system where the customer pays a monthly fixed subscription fee and a per-unit charge. In the commercial & industrial space, different models exist subject to an agreed Power Purchase Agreement. In most cases, as would be found in a solar-as-a-service installation for C&I, lease-to-own schemes or monthly bills based on a per-unit tariff are common.
System Operation
The physical and Functional Aspects
At the transmission level, the responsibilities of the System Operator include (KPMG, 2016):
- Implementing and enforcing Grid Code, and draft/implementation of operating procedures for the proper functioning of the grid
- System planning
- Implementing and supervising open access to the Grid
- Providing demand forecasts
- Planning operation and maintenance outages
- Undertaking dispatch and generation scheduling
- Scheduling energy allocated to each Load participant if available Generation is not sufficient to satisfy all loads
- Ensuring Reliability and availability of Ancillary Services; X. Undertaking real-time operation and SCADA/EMS system
- Administering system constraints (congestion), emergencies, and system partial or total recovery; and
- Coordinating regional Interconnectors.
While the System Operator handles the HV and EHV voltages at the grid level (132kV and 330kV), the distribution system operator (DSO) at the distribution level (33kV, 11kV, 0.415kV) must maintain, both short- and long-term, the capability of equipment, installations, and networks to supply the electricity continuously and reliably while meeting the quality requirements in force. This is vital for the operational security of electric power systems.
The regulatory and Business aspects
A system operation license authorizes the licensee to carry on system operation, including, but not limited to generation scheduling, commitment, and dispatch; transmission scheduling and generation outage coordination, transmission congestion management; international transmission coordination, procurement and scheduling of ancillary services and system planning for long term capacity, etc.
Electricity Demand
Peak Demand, annual energy consumption, and estimated future demand
Nigeria has Africa's largest population and economy, but Nigerians consume 144 kWh per capita annually, only 3.5% as much as South Africans [22]. With only 12.5 GW installed, and typically just one-third of that delivered, Nigerian power production falls far short of demand, which is a primary constraint on economic growth.
Self-generation in Nigeria is extremely prevalent; nearly 14GW capacity exists in small-scale diesel and petrol generators, and nearly half of all electricity consumed is self-generated. This implies a huge unserved demand.
The country's peak electricity demand is expected to grow to 15 GW by 2025 as the population grows and the economy booms. To meet this demand, the government is targeting a 90% electricity access rate by 2030, which will be supplied by an ambitious target of 45 GW of installed capacity in the same year (http://www.get-invest.eu/market-information/nigeria/energy-sector/ )
Demand curve
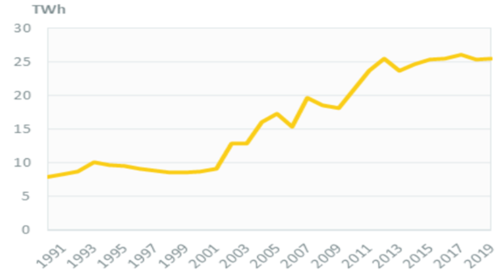
Electricity consumption increased rapidly between 2000 and 2012 (10%/year, on average), but has become roughly stable since then. However, with the government’s aggressive drive towards the targets set for the power sector and the substantial growth expected in the off-grid sector, an upward trend is expected through 2035 (Energy for Growth Hub, 2019)
Consumer categories and tariffs
In September 2020, the NERC flagged off a new tariff regime for the DIsCos which she termed a "Service Reflective Tariff". As the name implies, the Service Reflective Tariff was designed to reduce the incidence of estimated billing and lack of equity of pricing among consumers, as well as reflecting the quality of service measured by the number of hours of supply to clusters of electricity consumers.
While also considering equity and fairness, the tariff was also aimed at helping the utilities recover their efficient cost of operation, including a reasonable return on the capital invested in the business, and providing the path to transitioning the Nigerian Electricity Supply Industry, NESI to service-based cost-reflective tariffs by July 2021.
Tariff bands, customer categories, and prices are as follows:
Table 8: New Service Reflective Tariff
| Tariff Bands | Hours of Supply | New Tariff Class | Tariff Cost ₦/kwh |
| Lifeline | R2 | 4.00 | |
| Tariff Band A | 20 hrs. and above | NON-MD
MD-1 MD-2 MD-3 |
49.75
67.70 67.70 53.05 |
| Tariff Band B | 16 hrs. and above (but less than 20 hrs) | NON-MD
MD-1 MD-2 |
47.72
64.65 64.65 |
| Tariff Band C | 12 hrs. and above (but less than 16 hrs) | NON-MD
MD-1 MD-2 |
45.69
63.63 63.63 |
| Tariff Band D | 8 hrs. and above (but less than 12 hrs) | NON-MD
MD-1 MD-2 |
|
| Tariff Band E | 4 hrs. and above (but less than 8 hrs.) | NON-MD | frozen |
Source : https://sweetcrudereports.com/what-you-need-to-know-about-nercs-service-reflective-tariff/
Reliability of supply and quality of service
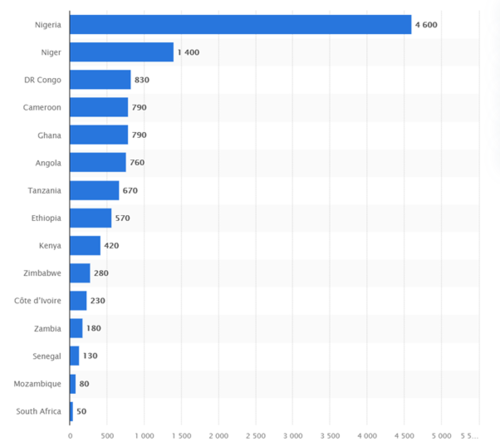
According to Statista, Nigeria topped the list of countries with the longest average annual outage duration in Africa in 2018 with 4,600 hours. This was 3,200 hours more than the next country on the list – Niger. The World Bank Enterprise Surveys 2019 highlighted unreliable electricity supply as a major constraint by almost 40% of firms in sub-Saharan Africa. A typical Nigerian firm experienced more than 32 electrical outages in 2018.
To enhance the effectiveness of service delivery in NESI, several interventions are needed to attract significant private sector capital, improve baseline power supply with data-driven innovations, and enhance sector governance. Specifically, CSEA advocates for a combination of Interventions - Operational and Technical, Financial, Governance, and Regulatory/Policy Interventions, especially related to tariffs and ATC&C loss reductions that balance the protection of electricity customers with the interests of investors.
Overall, with the strong drive towards a more diversified sector and strengthened grid, the future appears bright. One example of this drive is the deal between the Nigerian government and Siemens for the implementation of a road map to resolve challenges in Nigeria’s power sector.
The deal is structured in three phases. The first phase will focus on implementing projects that would greatly improve the power supply in Nigeria within a short period. The objectives are: to deliver an additional 2GW to the grid, to significantly reduce ATC&C losses, and to achieve improved grid stability and reliability. The following phase will target bringing the system's operational capacity to about 11G, while the third phase will involve increasing the system's capacity to 25GW within the medium to long term planning period, with appropriate upgrades and expansions in the generation, transmission, and distribution (BPE, 2019)
References
- Awogbemi, O. and Komolafe, C.A. 2011. Potential for sustainable renewable energy development in Nigeria. Pacific Journal of Science and Technology 10(1): 161-169
- Babatunde, M. A., Shauibu, M. I. (2011).The Demand for Residential Electricity in Nigeria,” Pakistan J. Appl. Econ., vol. 21, pp. 1–13, 2011
- Bello, M.A., Roslan, A.H., (2010). Has Poverty Reduced in Nigeria 20 Years After? Eur. J. Soc. Sci. 2010,15, 7–17.
- Bielecki, C., Wingenbach. G. (2014). Rethinking improved cookstove diffusion programs: A case study of social perceptions and cooking choices in rural Guatemala. Energy Policy 2014, 66, 350–358. [CrossRef]
- BioEnergy Consult, (2021).https://www.bioenergyconsult.com/biomass-energy-in-nigeria/
- Bonan. J., Pareglio. S., Tavoni, M. (2017). Access to modern energy: A review of barriers, drivers and impacts. Environ. Dev. Econ. 2017, 22, 491–516. [CrossRef]
- Buraimoh, E., Ejidokun., Temitayo. O., Ayamolowo, Oladimeji, J. (2017) Optimization of an Expanded Nigeria Electricity Grid System using Economic Load Dispatch. ABUAD Journal of Engineering Research and Development (AJERD), 1 (1). pp. 1-6.Iwayemi B. A., “Investment in Electricity Generation and Transmission in Nigeria, 2007; Issues and Options,” Int. Assoc. Energy Econ., 2007
- Bureau of Public Enterprises, (2019). https://bpe.gov.ng/fg-signs-agreement-with-siemens-for-implementation-of-the-road-map-to-resolve-challenges-in-nigerias-power-sector/
- Davidson, I. E., Okafor, F. N., Ojo,O., Jimoh, A. A. (2015). Power System Operation in Developing Economies – The Nigeria Experience,” in IFAC Conference on Technology Transfer in Developing Countries: Automation in Infrastructure Creation, 2001, no. May 2015, pp. 1–6.
- David-West, A. (2014). Nigerian power sector: Value investment opportunity or value trap? Lagos, Nigeria: CSL Stockbrokers Limited.
- Draft Rural Electricity Strategy and Implementation Plan 2015
- ECREEE (2016), op. cit.
- Edomah N., Chris. F., Aled J. (2016). Energy Transitions in Nigeria: The Evolution of Energy Infrastructure Provision (1800–2015). Energies 2016, 9, 484; doi:10.3390/en9070484
- Energy for Growth Hub, (2019) How Big Is Nigeria’s Power Demand? https://www.energyforgrowth.org/memo/how-big-is-nigerias-power-demand/
- Esi-africa, (2021). Katsina wind farm makes headway for Nigeria’s abandoned projects https://www.esi-africa.com/industry-sectors/renewable-energy/katsina-wind-farm-makes-headway-for-nigerias-abandoned-projects/
- Fatima. M.A. (2019). Nigeria: The NERC Mini-Grid Regulations And The Nigerian Mini_Grid Market: Opportunity For Investment
- GET.invest. Nigeria; Energy Sector. https://www.get-invest.eu/market-information/nigeria/energy-sector/
- Government of Nigeria, (2020); Nigeria Economic Sustainability Plan
- Henrich Boll Stiftung. (2017) Can Nigeria Meet its Electricity Goals by 2030? We found out. https://ng.boell.org/en/2019/10/11/can-nigeria-meet-its-electricity-goals-2030-we-found-out
- Henrich, V.S. (2021). Fostering an Enabling Policy Environment to Expand Clean-CookingAccess in Nigeria
- https://guardian.ng/news/nigeria-records-highest-power-transmission-of-5615-40mw/
- https://nerc.gov.ng/index.php/home/nesi/404-transmission
- Hydropower Status Report, (2018) https://www.hydropower.org/country-profiles/nigeria
- IEA (2020), SDG7: Data and Projections, IEA, Paris https://www.iea.org/reports/sdg7-data-and-projectionshttps://www.iea.org/reports/sdg7-data-and-projections/access-to-electricity
- IEA, (2019). Africa Energy Outlook
- IEA, (2019). Africa Energy Outlook.
- International Energy Agency. (2016). World Energy Outlook. Paris, France, 2016.
- KPMG (2016). Nigerian Power Sector Guide
- KPMG. (2016). A guide to the Nigerian power sector.
- Lim, J., Schwarz, S., Schwarz. D.,Maru, R (2013). A rights-based approach to indoor air pollution. Health Hum. Rights 2013, 15, 160–167. [PubMed]
- Market Insights, (2021). Connecting Australian Business to the World: Nigeria Market Insights 2021
- Medium,(2016).Conversation with Kunle Odebunmi of Anergy (https://medium.com/@GridlessAfrica/conversation-with-kunle-odebunmi-ofarnergy-payg-solar-home-systems-671d06deb3fc) Accessed 30 August 2017
- Mini-Grids in Nigeria, (2017). A Case Study of a Promising Market, November 2017, the World Bank Group. Source: file:///F:/Nigeria%20Mini%20Grids%20by%20World%20Bank.pdf
- Mohapatra. S., Simon. L. (2017). Intra-household bargaining over household technology adoption. Rev. Econ. Househ. 2017, 15, 1263–1290. [CrossRef]
- Multi Year Tariff Order (MYTO), (2015). Transmission Tariff. https://nerc.gov.ng/index.php/home/myto/407-transmission-tariff
- Nigeria Living Standards Survey, 2018-19. Note: The estimates exclude Borno state.Source: Data from the World Development Indicators database: Country: Nigeria. Last Updated:05/25/2021
- Omorogiuwa,E., Eseosa,O., Ogujor, E.O. (2012). Determination Of Bus Voltages, Power Losses And Flows in the Nigeria 330kv Integrated Power System,” 2012.
- Onuoha, K. (2016). The Electricity Industry in Nigeria : What are the Challenges and Options Available to Improve the Sector ? SSRN Electron. J., no. May 2010, 2016.
- Owolabi, A., Nsafon, B.,Huh, Jeung-Soo. (2019). Validating the techno-economic and environmental sustainability of solar PV technology in Nigeria using RETScreen Experts to assess its viability. Sustainable Energy Technologies and Assessments. 36. 100542. 10.1016/j.seta.2019.100542. https://www.researchgate.net/figure/Solar-radiation-map-of-Nigeria-1-Yobe-State-is-considered-as-the-best-site-for-the_fig1_337665203
- Precious, A.(2019). How Big is Nigeria’s Power Demand? https://www.energyforgrowth.org/memo/how-big-is-nigerias-power-demand/
- REA, (2019). Opportunities in the Off-Grid Sector in Nigeria: Focus on the Nigeria Electrification Project (NEP)
- Rural Electrification Agency, (2017).Nigerian Mini-Grid Investment Brief, December 2017,.
- Rural Electrification Agency, (2019). How off-grid devt ‘ll rescue Nigeria power sector. https://rea.gov.ng/off-grid-devt-ll-rescue-nigeria-power-sector/
- Rural Electrification Agency, Energizing Economies Initiative (REA,EEI). http://rea.gov.ng/energizing-economies/
- Sambo, A., Garba, B., Zarma, I., Gaji, M. (2010). Electricity Generation and the Present Challenges in the Nigerian Power Sector. J Energy Power Eng. 6.
- Shell Foundation, (2018). Nigerian Off-Grid Market Acceleration Program: Mapping the Market
- Solomon. O., Philip O.B., Adeyinka M.A. Presentation on Environmental statistics: The Situation In The Situation in Federal Republic of Nigeria
- Sule, A.H. (2010). Major Factors Affecting Electricity Generation, Transmission and Distribution in Nigeria.
- Sweet Crude Reports, (2020).What you need to know about NERC’s Service Reflective Tariff https://sweetcrudereports.com/what-you-need-to-know-about-nercs-service-reflective-tariff/
- Techcabal, (2018). Hydropower-dominates-africas-renewables-but-over-80-of-its-potential-remains-untappedhttps://techcabal.com/2018/09/20/hydropower-dominates-africas-renewables-but-over-80-of-its-potential-remains-untapped/
- The Nation, (2019). BPE offers five GenCos to investors.https://thenationonlineng.net/bpe-offers-five-gencos-to-investors/
- The Nigerian Energy Report 2019
- The Solar Report Nigeria. Commissioned by the Netherlands Enterprise Agency. https://www.rvo.nl/sites/default/files/2021/06/Solar-Report-Nigeria.pdf
- The World Bank, (2018). Nigeria Electrification Project (P161885)
- Tracking SDG7: The Energy progress Report 2021 – World bank
- Ugochukwu, O.R., Chinyere, A.N., Jane, M., Uwazie. I., Nkechinyere.U.,Christian. O., Uwadoka., Jonathan. O. A. (2019). Improved Cook-stoves and Environmental and Health Outcomes: Lessons from Cross River State, Nigeria
- UNDP in Nigeria, Goal 5: Gender equality |https://www.ng.undp.org/content/nigeria/en/home/sustainable-development-goals/goal-5-gender-equality.html
- UNDP SDG Investor Platform, (2021).Nigeria https://sdginvestorplatform.undp.org/country/nigeria
- Urmee, T., Gyamfi. S. (2014). A review of improved Cookstove technologies and programs. Renew. Sustain. Energy Rev. 2014, 33, 625–635. [CrossRef]
- USAID Power Africa, (2020). Nigeria Energy Sector. https://www.usaid.gov/powerafrica/nigeria
- USAID, (2021). Nigeria Power Africa Fact Sheet. https://www.usaid.gov/powerafrica/nigeria
- World Bank. Country Brief: Nigeria. https://www.worldbank.org/en/country/nigeria
- https://www.ace-taf.org/wp-content/uploads/2021/03/Stand-Alone-Solar-Investment-Map-Nigeria.pdf)
- file:///F:/Nigeria%20Mini%20grid%20Investment%20Brief.pdf
- https://nerc.gov.ng/index.php/home/nesi/401-history
- https://www.cleancookingalliance.org/country-profiles/focus-countries/3-nigeria.html
- https://unfccc.int/climate-action/momentum-for-change/activity-database/momentum-for-change-towards-creating-low-carbon-green-urja-urban-poor-slums
- https://www.macrotrends.net/countries/NGA/nigeria/population
- https://www.statista.com/statistics/382311/nigeria-gdp-distribution-across-economic-sectors/
- https://www.ace-taf.org/wp-content/uploads/2021/03/Stand-Alone-Solar-Investment-Map-Nigeria.pdf
- https://guardian.ng/news/nigeria-records-highest-power-transmission-of-5615-40mw/
- https://www.sciencedirect.com/science/article/pii/S1364032116301605#:~:text=Nigeria%20has%20substantial%20biomass%20potential,to%20meet%20their%20energy%20needs.
- https://www.enerdata.net/estore/energy-market/nigeria/
- https://www.statista.com/statistics/617570/average-monthly-electricity-outage-africa-by-select-country/#:~:text=As%20of%202018%2C%20the%20average,Nigeria%20stood%20at%204%2C600%20hours.
- http://cseaafrica.org/challenges-and-interventions-needs-in-the-nigerian-electricity-supply-industry-nesi/
- https://www.sciencedirect.com/science/article/pii/S1364032116301605#:~:text=Nigeria%20has%20substantial%20biomass%20potential,to%20meet%20their%20energy%20needs.

