Data Mapping on the Productive Uses of Energy (PUE) For Agriculture Can Help Mitigate Existing Climatic and Socio-Economic Challenges in Drought Affected Counties – A Kenya Case Study
Authors: Douglas Ronoh, Dimitrios Mentis, PhD., Christine Odeph (World Resources Institute)
Background
More than 18.5 million people living in the horn of Africa are facing an acute food insecurity crisis. The region comprising Ethiopia, Kenya, Somalia, and Djibouti has endured three severe droughts (2010-2011, 2016-2017, and 2020-2021). In 2022, at least 36.1 million people in the region were hit by one of the most severe and longest droughts in over forty years. And The World Food Program says the number of food-insecure people will increase well into 2023. As pasturelands and water points dry up in the horn of Africa, pastoralists and rural communities who depend on natural resources are witnessing the death of their livestock and the loss of their livelihoods. In Kenya, it is estimated that 4.2 million people - close to a quarter of the population in the arid and semi-arid lands of north and east Kenya are acutely food insecure as of 2022. Currently, 13 out of 47 counties including Narok and Makueni are in the alert drought phase. Data mapping on Productive Uses of Energy (PUE) has a critical role to play in mitigating and adapting to these crises. Productive Uses of Energy (PUE) are considered a key driver of economic development since energy can power industrial, agricultural, and commercial appliances to generate income and support poverty alleviation. In Kenya, the share of agriculture in the country’s Gross Domestic Product (GDP) is about 22%, higher than the regional average in the Sub-Saharan Africa region (17.2%) and the global average (4.3%). Stakeholders involved in the emerging PUE space require access to transparent analytical tools and data to identify priority areas for effectively implementing PUE interventions. But for a time, there was no access to a dynamic information system that captured relevant, granular data on PUE opportunities in the space. World Resources Institute (WRI), Strathmore University, and SNV Netherlands Development Organization collaborated to expand on the Energy Access Explorer (EAE) to address this gap. The EAE is an open-source, integrated, inclusive, and data-driven approach to aid in planning for the expansion of energy access. The partners collaborated to include additional PUE-related information and enable associated use cases in Kenya's three counties: Narok, Bungoma, and Makueni These counties are significantly different in terms of their geographic, climatic, cultural, and socio-economic context. Yet one thing that the 2019 Demographics Census revealed to be common among them is their low electricity connection rates and high reliance on agriculture for their livelihoods. The table below with findings from the 2019 Kenya Population and Housing Census[1] illustrates this further:
Most households practicing agriculture in these three counties still rely on rainfall as their main source of water during planting seasons which also provide pasture and water for livestock. This has proven quite a challenge over the past 20 – 30 years due to the negative effects of climate change resulting in unpredictable rainfall seasons. Prolonged dry spells and droughts negatively affect crops like maize, and intense precipitation over short duration causes flash floods that destroy crops and property.[2] Livestock rearing has not been spared either. Pastoralists are increasingly travelling longer distances in search of pasture and water for their animals. The need to upscale energy uptake for productive uses in agriculture to increase adaptation to and tackle some of the effects of environment and climate changes in these three counties cannot be over-emphasized. Electricity can power irrigation systems to solve the issue of rainfall unreliability and for cooling and processing farm outputs like milk to increase their value and shelf-life while diversifying sources of livelihoods to reduce over-reliance on agriculture. However, this is still a far-fetched dream for many families in these counties. The big question that energy planners, investors, development partners, and other stakeholders who can make this dream a reality for these families grapple with is: where are the opportunities for agricultural PUE located in these three counties? The answer lies in a thorough understanding of the spatial context of the counties with analysis of various datasets on drivers of PUE, such as the location of farmers, markets, and existing PUE activities, to identify where interventions would yield the highest impact. The main challenge has always been the scarcity of most of these datasets, if any. Building on the Energy Access Explorer initiative, SNV Netherlands Development Organization partnered with WRI and Strathmore Energy Research Centre (SERC) - under the Energizing Development (EnDev) Programme to collect, map out and analyze data on PUE opportunities across these three counties.
Methodology: PUE data collection and integration
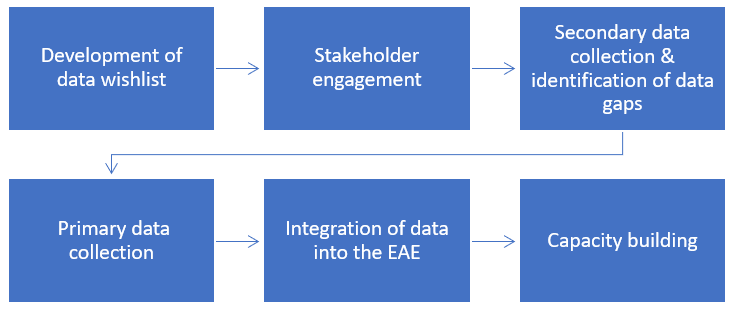
This project involved using a data driven approach to demonstrate opportunities for energizing agriculture at the sub-national level in Kenya. Obtaining high quality geospatial and non-geospatial data demonstrating productive use of energy was at the heart of this initiative. Once collected, the data was then integrated into the EAE platform. We adopted 6 steps to customize the Energy Access Explorer for PUE cases in these three counties. First, we developed a data wish list. This was followed by a dynamic engagement with stakeholders. Then we collected secondary and primary data which were harmonized and integrated into the online Energy Access Explorer. Finally, we trained relevant stakeholders. This is a rather dynamic process, and training is not the end of this initiative, but rather an important milestone. The flow chart below illustrates the methodology that was employed to develop the productive use of energy maps for Makueni, Bungoma and Narok.
Examples of PUE datasets collected included locations of farms, agro-processing facilities, agriculture markets, agricultural input suppliers, and solar solution suppliers.
Important findings from data collected.
1. Rainfed croplands occupies a significant portion of the total land mass in the three counties.
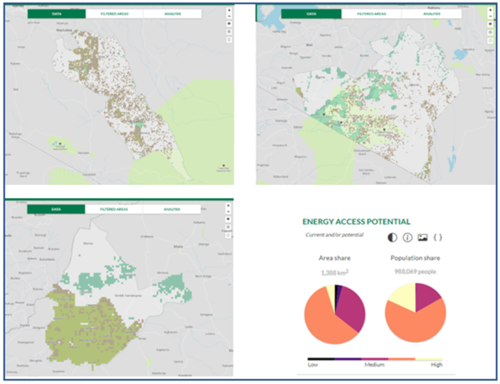
Spatial data that was loaded into the EAE from the NASA Earth Science Data and Information System (ESDIS) project[3], shows evidence that most of the total cropland area in the three counties rely on rainfall with only small portions practicing irrigated agriculture. These rainfed crop areas occupy a large portion of the total areas of their respective counties with Narok having 3,094km2, Makueni 2,703km2 and Bungoma 1,388km2 of rainfed croplands. This represents 17%, 32%, and 43% of the total areas of their counties respectively. The maps below extracted from the EAE display the spatial distribution of these rainfed croplands.
These statistics indicate very high dependency on rainfall for agriculture which could exacerbate the existing food crisis caused by recent climatic conditions in Northern Kenya.[4] It is thus important to prioritize energy access to these areas where farming is done to encourage PUE activities that would lead to greater resilience and better yields.
2. The demand for agro-processing and other PUE activities in the three counties is high but uptake remains low.
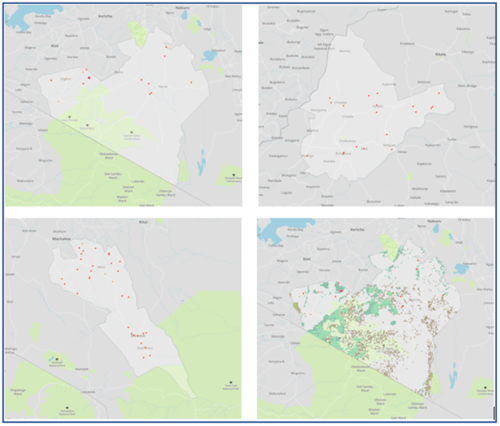
Despite the economic benefits of agro-processing, its uptake in the three counties remains quite low compared to the demand. We identified 40 agro-processing facilities in Narok County, 56 in Makueni and 29 in Bungoma. The maps below illustrate the spatial distribution of these facilities.
When compared to the locations of the rainfed farms, and assuming an agro-processing facility can serve farms within a radius of 10km, analysis done on the EAE indicated that 2,776km2 of farmland in Narok, 1,012km2 of farmland in Makueni and 332km2 of farmland in Bungoma were out of the range the agro-processing facilities available could cover. This represents 90%, 37%, and 24% of the total rainfed farms respectively, also assuming the available agro-processing facilities have the capacity to process the produce of all the farms within their range which is not always the case. This lack of sufficient agro-processing facilities could also be associated with unavailable or insufficient energy supply, which is a key requirement for most agro-processing plants; thus, with the locations of these farms known, energy supply around them would be critical in order to set up enough agro-processing facilities to meet this demand - leading to improved profits and improved livelihoods from farming activities.
3. Higher poverty rates are located in areas further away from the grid
An analysis of the data collected in the EAE also revealed an interesting statistic with regards to poverty in the 3 counties. By overlaying data on relative wealth index from Data for Good at Meta[5] which predicts the relative standard of living within a country with the grid distribution lines network data from KPLC[6], it is evident that higher percentage of the population living below the average household wealth are located further from the grid. Equally notable is most of the areas identified as having population living below the average household wealth in the country have a significant amount of rainfed croplands which indicates that agriculture is the main source of livelihood. Also of note is most agro-processing activities and markets are located closer to the grid. The maps below indicate these findings.
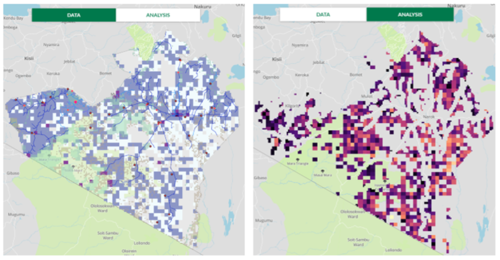
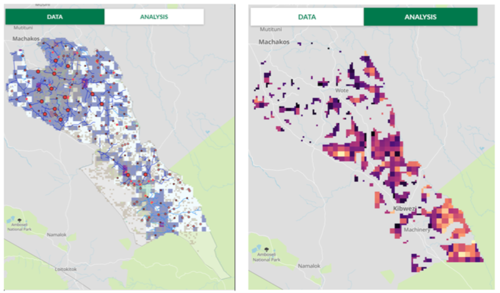

As is evident in the above analysis, lack of energy access and high poverty rates are directly proportional. This means that supplying energy to the areas where the poverty rates are high, especially those with farming activities going on can trigger productive use of energy activities that would improve the economic livelihoods of the communities living there. The impacts of such initiatives could greatly benefit the 315,523 people in Narok, 192,654 in Makueni and 378,188 in Bungoma living in poverty and far away from the grid. The EAE can help identify such areas as above with prioritization analysis done to determine which areas to prioritize energy access, from areas with highest potential to lower potential based on the data and filters on demand and supply of energy. The above examples use the Assistance Need Index feature of the EAE which indicates areas with high energy demand, low economic activity and low access to infrastructure and resources. Brighter colors on the map shows areas with high potential for extending energy access based on this index. It can also go a step further to identify the potential of using renewable energy sources such as solar, wind or hydro to electrify areas far from the grid.
Conclusion and Way Forward
In conclusion, the use of spatial data and analytics at the energy – productive use nexus can enable: - Strategic and Integrated Energy Planning where county government officials can better link energy access and productive uses. - Expansion of clean energy and PUE markets where technology suppliers may get a better understanding of where to expand their businesses. - Impact investment where donors, development finance institutions and investors may identify areas where grants, support, investment towards PUE will have the most impact.
Moving forward, it is essential to keep this database up to date for the three counties and to scale this effort to include other counties in Kenya that could benefit from the use of a data-driven, integrated, and inclusive approach to energizing productive uses where it’s needed the most.
- ↑ KNBS (2019). Kenya Population and Housing Census Volume IV. Available from: https://open.africa/dataset/2019-kenya-population-and-housing-census/resource/08201cfd-421f-45c3-90fb-578356f00cf9
- ↑ MoALFC (2021) Kenya County Climate Risk Profile: Narok County. Nairobi (Kenya): Ministry of Agriculture, Livestock, Fisheries and Co-operatives (MoALFC) 33 p. Available from: https://cgspace.cgiar.org/handle/10568/115039
- ↑ P. Thenkabail, P. Teluguntla, J Xiong, A. Oliphant, R. Massey (2016). NASA MEaSUREs Global Food Security Support Analysis Data (GFSAD) Crop Dominance 2010 Global 1 km V001. NASA EOSDIS Land Processes. Retrieved from DAAC.https://doi.org/10.5067/MEaSUREs/GFSAD/GFSAD1KCM.001 Accessed through Energy Access Explorer, [07/27/2022]. www.energyaccessexplorer.org.
- ↑ Institute of Security Studies (2011). The Cycle of Drought in Kenya a Looming Humanitarian Crisis. Available from: https://issafrica.org/iss-today/the-cycle-of-drought-in-kenya-a-looming-humanitarian-crisis
- ↑ Chi, G., Fang, H., Chatterjee, S., Blumenstock, J.E.. 2022. Microestimates of Wealth for All Low- and Middle-Income Countries. Proceedings of the National Academy of Sciences, January 2022. Available from https://www.pnas.org/doi/10.1073/pnas.2113658119. Accessed through Energy Access Explorer, [1/31/2023]. www.energyaccessexplorer.org
- ↑ Kenya Power and Lighting Company (KPLC) & World Bank Group. Kenya - Kenya Electricity Network (2017). Accessed through Energy Access Explorer, [07/27/2022]. www.energyaccessexplorer.org.


