File:Fig 3- Maps showing distribution of croplands in Makueni (top left) .png
From energypedia
No higher resolution available.
Fig_3-_Maps_showing_distribution_of_croplands_in_Makueni_(top_left)_.png (748 × 575 pixels, file size: 307 KB, MIME type: image/png)
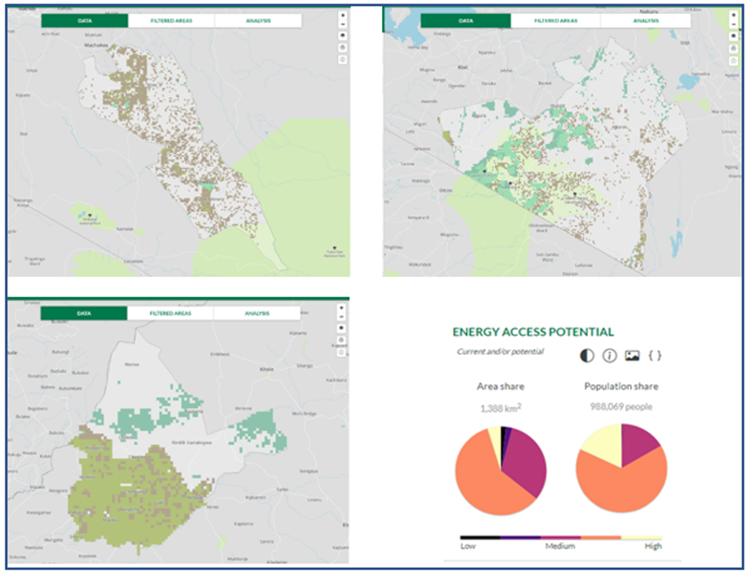
Fig 3: Maps showing distribution of croplands in Makueni (top left), Narok (top right) and Bungoma Counties (bottom left) with sample analytics on area and population living in areas occupied by rainfed croplands for Bungoma also shown (bottom right)
File history
Click on a date/time to view the file as it appeared at that time.
| Date/Time | Thumbnail | Dimensions | User | Comment | |
|---|---|---|---|---|---|
| current | 13:18, 16 May 2023 | | 748 × 575 (307 KB) | ***** (***** | *****) |
You cannot overwrite this file.


_.png&oldid=409918)
_.png)
_.png&action=edit&redlink=1)
_.png&action=edit)
_.png&action=history)
_.png)
_.png)
_.png&oldid=409918)
_.png&action=info)
-5F.png)