Knowledge fuels change - Support energypedia!
For over 10 years, energypedia has been connecting energy experts around the world — helping them share knowledge, learn from each other, and accelerate the global energy transition.
Today, we ask for your support to keep this platform free and accessible to all.
Even a small contribution makes a big difference! If just 10–20% of our 60,000+ monthly visitors donated the equivalent of a cup of coffee — €5 — Energypedia would be fully funded for a whole year.
Is the knowledge you’ve gained through Energypedia this year worth €5 or more?
Your donation keeps the platform running, helps us create new knowledge products, and contributes directly to achieving SDG 7.
Thank you for your support, your donation, big or small, truly matters!
Difference between revisions of "Microenergysystems in the Context of Climate Change and Economical Development - A Valuable Proposition?"
***** (***** | *****) |
***** (***** | *****) m |
||
| (15 intermediate revisions by 2 users not shown) | |||
| Line 1: | Line 1: | ||
| − | = | + | {| cellspacing="3" cellpadding="5" border="0" style="font-size: 13.63636302947998px; width: 800px" |
| + | |- | ||
| + | | style="width: 16px" | <span style="color: rgb(192, 0, 0); line-height: 21px"></span><span style="color: rgb(192, 0, 0); line-height: 21px">►</span> | ||
| + | | style="width: 749px" | '''[[Energy in Development - Lecture Series|Back to the Lecture Series: Energy in Development]]''' | ||
| + | |} | ||
| + | |||
| + | <br/> | ||
| + | |||
| + | = Presentation = | ||
| + | |||
| + | [[File:1911 Steckel-1.pdf|thumb|left|180px|Dr. Steckels Presentation]] | ||
| + | |||
| + | <br/> | ||
= Climate Change Mitigation<br/> = | = Climate Change Mitigation<br/> = | ||
| − | Dr. Steckel is working on the IPCC report | + | [[File:World Map Vulnerability.png|thumb|290px|World Map Vulnerability]][[File:Wealth and Carbon Debt per country.png|thumb|290px|Wealth and Carbon Debt per country]]Dr. Jan Steckel is one of these important researchers working on the IPCC report. At the moment the report gets updated - numbers and figures that are most recent have to be juggled.<br/> |
| − | + | <u>These new numbers conclude on a well-known picture:</u><br/> | |
*Developing countries suffer most from climate change.<br/> | *Developing countries suffer most from climate change.<br/> | ||
| − | *Developed countries cause it. <br/> | + | *Developed countries cause it.<br/> |
| − | + | The grey sections in the map on the right show the largest CO2 emitters, the red countries are most vulnerable to climate change in social and/or agro-economic sectors. Most countries are either responsible for or suffer under climate change - few emitters suffer themselves. The developing countries both see the most dramatic changes of their local climats and they are also less prepared to adapt to climate changes.<br/> | |
| − | + | It is a moral dilemma: the south suffers, the north emits the CO2 and the business as usual scenarios see an increase of emissions. | |
| − | + | The second graph shows the correlation of the wealth of a country in US $2,000 per person and its carbon debts in kilograms carbon emitted per person and year. Countries are closely positioned around the fitting line. This suggests, that wealth and emission of CO2 presuppose each other. Further research has been carried out to see whether development has to come together with increased CO2 emissions.<br/> | |
| − | + | <br/> | |
| − | = Energy | + | <br/> |
| + | |||
| + | = Development, Emissions and their Drivers = | ||
| + | |||
| + | [[File:Energy Use OECD and Developing.png|thumb|290px|Energy Use OECD and Developing Countries]] [[File:Shares of Primary Energy.png|thumb|290px|Shares of Pimary Energy]] The first graph shows how the use of energy differs in developing and OECD countries and shows a development from 1971 to 2006. Clearly, developing countries have raised their energy consumption. In the residential sector a slight rising indicates that domestic consumption has augmented only a bit. The energy consumption in the agroculture and fisheries has remained stable. Most rise in energy consumption comes from services, industry and transport. In the same time transport is the only sector in the OECD countries that has augmented significantly.<br/> | ||
| + | |||
| + | The energy ressources that supply the world with primary energy (that is electricity, mobility and heat) are shown in the graph below: | ||
| + | *the largest share has oil with 34.6% | ||
| + | *next is coal with 28.4% and gas with 22.1% | ||
| + | *renewable energies sum up to 12.9% whereof the biggest share is provided by biomass | ||
| + | |||
| + | More than half of the biomass is still being used in a traditional way as for example as firewood. The modern usage of biomass as resource for biogas plants or liquid propellant already sums up to 4% of the worlds energy supply which is double the share of nuclear energy. | ||
| + | |||
| + | <br/> | ||
| + | |||
| + | <br/> | ||
| + | |||
| + | = Energy and Development = | ||
| + | |||
| + | [[File:Energy in Development Processes.png|thumb|290px|Energy in Development Processes]]Recently, Dr. Steckel and his collegues had a closer look on the role of energy in the development processes. The graph on the right shows values of the Human Developement Index (HDI) 2010 calculated according to a new method per energy use per person in Giga Joules per year. The HDI in this graph bases on the years 1980 to 2005 and summarizes factors such as GDP, the education level, health and others. The numbers are normalized to 1, which goes to the best country. The percentage of HDI has been revised and interpreted so that: | ||
| + | *less than 47% is a very low HDI | ||
| + | *up to 63% is a low HDI | ||
| + | *up to 75% is a medium HDI | ||
| + | *up to 89% is a high HDI | ||
| + | *above this a country has a very high HDI. | ||
| + | |||
| + | According to Dr. Steckels research group a citizen has to use at least 15 Giga Joules per year (GJ/a) to secure it's basic needs. The threshold on the society level is at approximately 40 GJ per capita. [??] The graph shows again that it is generally necessary to spend energy to get a high HDI. Furthermore, some countries are examined closer. | ||
| + | |||
| + | The negative extreme is the Congo that has not developed its energy use over the period of 1980 to 2005 and that is still close to being classified as very low developed. | ||
| + | |||
| + | Next comes India that has developed from being classified as very low to being low developed. Its energy use per capita has slightly increased from 10 to about 15 GJ/a. | ||
| + | |||
| + | Costa Rica has risen from being classified as low to medium developed and could soon be classified as being high developed without having crossed the threshold of 40 GJ/a. This is a special case because Costa Rica is highly attractive to tourism. | ||
| + | |||
| + | China's HDI shows the most steep rise which finally in the early 2000's crossed both the threshold of 40 GJ/a and the classification line of medium developed countries. This steep rise can be explained with the big injustice in the supply with energy and wealth. The huge countries high society consumes a lot of energy but as still a high percentage lives on the countryside the energy consumption per capita is comparatively low. | ||
| + | |||
| + | Korea started in 1980 with a low HDI and less than 15 GJ/a energy consumption per capita. It has since then developed both in HDI and energy consumption and is on the edge to being counted as very high developed country with an energy consumption per capita of nearly 150 GJ/a. | ||
| + | |||
| + | The opposite extreme to the Congo is the USA which has both a high to very high ranking according to the HDI and the highest energy consumption with over 200 GJ/a. | ||
| + | |||
| + | <br/> | ||
| + | |||
| + | [[File:Energy Use in Developing Countries.png|thumb|290px|Energy Use in Developing Countries]]The second graph shows the energy consumption in developing countries devided up into rural and urban areas and into income quintiles. These quintiles each represent a fifth of the population depending on their income. The graph reveals different aspects of wealth distribution in developing countries: | ||
| + | *The difference in income in rural areas is minor, whereas poor people in cities have remarkably less income than the highest quintile. | ||
| + | *Firewood is an energy resource for the poor. | ||
| + | *Citizens with high income prefer gas and electricity as energy resources. | ||
| + | *Energy efficiencies is higher in cities. | ||
| + | |||
| + | The high share of firewood in the energy consumption of developing countries derives from the fact that 75% of people in rural areas use it for cooking, compared to 35% in urban areas. [[Improved Cookstoves|Improved cooking stoves]] are only used by a fourth of the households using firewood as cooking resource. | ||
| + | |||
| + | <br/> | ||
| + | |||
| + | = Energy System Transformations – Opportunities, Trade‐offs and Risks = | ||
| + | |||
| + | <br/> | ||
| + | |||
| + | = Conclusions = | ||
| + | |||
| + | *Development and carbon emissions highly correlated | ||
| + | *At current (relative) prices of fossil fuels it is not realistic to expect a decarbonization of development patters in the short term (without policy intervention) | ||
| + | *Low carbon technologies, particularly renewable energy not cost competitive in the short run | ||
| + | *Even on smallest scale, high income threshold | ||
| + | *Strategies to decarbonize energy systems on large scale are necessary and feasible, but might collide with other development goals | ||
| + | *Short term strategy: Improve institutional quality and provide minimum access to basic infrastructures to help the poor | ||
| + | |||
| + | <br/> | ||
| + | |||
| + | = Further Information = | ||
| + | |||
| + | *Doll, Christopher N.H. and Pachauri, S. (2010): Estimating rural populations without access to electricity in developing countries through night‐time light satellite imagery. Energy Policy, 38(10), pp. 5661‐5670. | ||
| + | *Edenhofer et al. (2011): Renewable Energy in the Context of Sustainable Development. In IPCC Special Report on Renewable Energy Sources and Climate Change Mitigation. | ||
| + | *GEA (2012): Global Energy Assessment – Toward a Sustainable Future, Cambridge University Press, Cambridge UK and New York, NY, USA and the International Institute for Applied Systems Analysis, Laxenburg, Austria. | ||
| + | *Grübler, A., 2004. Transitions in energy use. In: Cleveland, C.G. (Ed.), Encyclopedia of Energy, Vol. 6. Elsevier. | ||
| + | *IEA (International Energy Agency) 2010, World Energy Outlook 2010, OECD/IEA, Paris. | ||
| + | *Jakob, M., M. Haller, R. Marschinski (2012): Will History Repeat Itself? Economic Convergence and Convergence in Energy Use Patterns. Energy Economics 34, p. 95‐104. | ||
| + | *Jakob, M., R. Marschinski, M. Hübler (2013): Between a Rock and a Hard Place: A Trade‐Theory Analysis of Leakage under Production‐ and Consumption‐Based Policies. Environmental and Resource Economics, forthcoming. | ||
| + | *Jakob and Steckel (2013): How climate change mitigation could harm development in poor countries. WIREs Climate Change, forthcoming. | ||
| + | *Knopf, Brigitte; Yen‐Heng Henry Chen, Enrica De Cian, Hannah Förster, Amit Kanudia, Ioanna Karkatsouli, Ilkka Keppo , Tiina Koljonen, Katja Schumacher, Detlef P. van Vuuren: Beyond 2020 ‐ Strategies and costs for transforming the European energy system. Overview paper of the EMF28 model comparison of the EU Energy Roadmap, Climate Change Economics. | ||
| + | *Luderer G, Krey V, Calvin K, Merrick J, Mima S, Pietzcker RC, Vliet J van, Wada K (2013): The role of renewable energy in climate stabilization: results from the EMF27 scenarios. Clim Change, in press. | ||
| + | *Schäfer, A. (2005): Structural change in energy use, Energy Policy, 33(4), pp. 429‐437. | ||
| + | *Steckel, J., M. Jakob, R. Marschinski and G. Luderer (2011): From carbonization to decarbonization? Past trands and future scenarios for China’s CO2 emissions. Energy policy, 39 (6), pp. 3443‐3455. | ||
| + | *Steckel, J, RJ Brecha, M. Jakob, J. Strefler, G. Luderer (2013): Development without energy? Assessing future scenarios of energy consumption in developing countries. Ecological Economics, 90, pp. 53‐67. | ||
| + | *David I. Stern. (2011): The role of energy in economic growth in “Ecological Economics Reviews.” Robert Costanza, Karin Limburg & Ida Kubiszewski, Eds. Ann. N.Y. Acad. Sci. 1219: 26–51. | ||
| + | |||
| + | <br/> | ||
= References<br/> = | = References<br/> = | ||
| + | |||
| + | <references /><br/> | ||
| + | |||
| + | [[Category:Microenergy_Systems]] | ||
| + | [[Category:Energy_Efficiency]] | ||
| + | [[Category:Climate_Change]] | ||
| + | [[Category:Impacts_Economic]] | ||
| + | [[Category:University]] | ||
| + | [[Category:Conference_Documentation]] | ||
| + | [[Category:Energy_Use]] | ||
| + | [[Category:Energy_Access]] | ||
Latest revision as of 12:35, 11 December 2013
| ► | Back to the Lecture Series: Energy in Development |
Presentation
Climate Change Mitigation
Dr. Jan Steckel is one of these important researchers working on the IPCC report. At the moment the report gets updated - numbers and figures that are most recent have to be juggled.
These new numbers conclude on a well-known picture:
- Developing countries suffer most from climate change.
- Developed countries cause it.
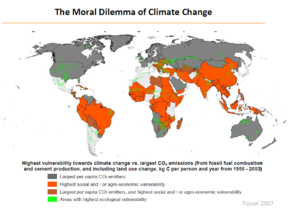
The grey sections in the map on the right show the largest CO2 emitters, the red countries are most vulnerable to climate change in social and/or agro-economic sectors. Most countries are either responsible for or suffer under climate change - few emitters suffer themselves. The developing countries both see the most dramatic changes of their local climats and they are also less prepared to adapt to climate changes.
It is a moral dilemma: the south suffers, the north emits the CO2 and the business as usual scenarios see an increase of emissions.
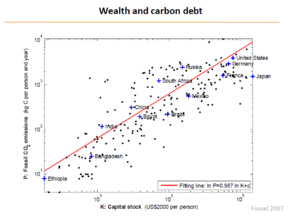
The second graph shows the correlation of the wealth of a country in US $2,000 per person and its carbon debts in kilograms carbon emitted per person and year. Countries are closely positioned around the fitting line. This suggests, that wealth and emission of CO2 presuppose each other. Further research has been carried out to see whether development has to come together with increased CO2 emissions.
Development, Emissions and their Drivers
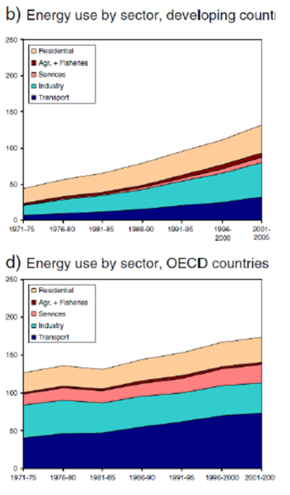
The first graph shows how the use of energy differs in developing and OECD countries and shows a development from 1971 to 2006. Clearly, developing countries have raised their energy consumption. In the residential sector a slight rising indicates that domestic consumption has augmented only a bit. The energy consumption in the agroculture and fisheries has remained stable. Most rise in energy consumption comes from services, industry and transport. In the same time transport is the only sector in the OECD countries that has augmented significantly.
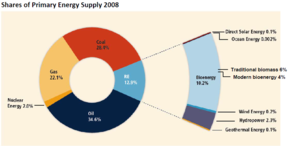
The energy ressources that supply the world with primary energy (that is electricity, mobility and heat) are shown in the graph below:
- the largest share has oil with 34.6%
- next is coal with 28.4% and gas with 22.1%
- renewable energies sum up to 12.9% whereof the biggest share is provided by biomass
More than half of the biomass is still being used in a traditional way as for example as firewood. The modern usage of biomass as resource for biogas plants or liquid propellant already sums up to 4% of the worlds energy supply which is double the share of nuclear energy.
Energy and Development
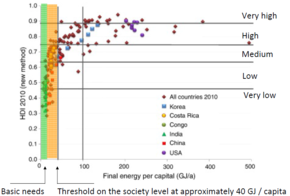
Recently, Dr. Steckel and his collegues had a closer look on the role of energy in the development processes. The graph on the right shows values of the Human Developement Index (HDI) 2010 calculated according to a new method per energy use per person in Giga Joules per year. The HDI in this graph bases on the years 1980 to 2005 and summarizes factors such as GDP, the education level, health and others. The numbers are normalized to 1, which goes to the best country. The percentage of HDI has been revised and interpreted so that:
- less than 47% is a very low HDI
- up to 63% is a low HDI
- up to 75% is a medium HDI
- up to 89% is a high HDI
- above this a country has a very high HDI.
According to Dr. Steckels research group a citizen has to use at least 15 Giga Joules per year (GJ/a) to secure it's basic needs. The threshold on the society level is at approximately 40 GJ per capita. [??] The graph shows again that it is generally necessary to spend energy to get a high HDI. Furthermore, some countries are examined closer.
The negative extreme is the Congo that has not developed its energy use over the period of 1980 to 2005 and that is still close to being classified as very low developed.
Next comes India that has developed from being classified as very low to being low developed. Its energy use per capita has slightly increased from 10 to about 15 GJ/a.
Costa Rica has risen from being classified as low to medium developed and could soon be classified as being high developed without having crossed the threshold of 40 GJ/a. This is a special case because Costa Rica is highly attractive to tourism.
China's HDI shows the most steep rise which finally in the early 2000's crossed both the threshold of 40 GJ/a and the classification line of medium developed countries. This steep rise can be explained with the big injustice in the supply with energy and wealth. The huge countries high society consumes a lot of energy but as still a high percentage lives on the countryside the energy consumption per capita is comparatively low.
Korea started in 1980 with a low HDI and less than 15 GJ/a energy consumption per capita. It has since then developed both in HDI and energy consumption and is on the edge to being counted as very high developed country with an energy consumption per capita of nearly 150 GJ/a.
The opposite extreme to the Congo is the USA which has both a high to very high ranking according to the HDI and the highest energy consumption with over 200 GJ/a.
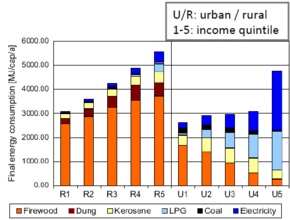
The second graph shows the energy consumption in developing countries devided up into rural and urban areas and into income quintiles. These quintiles each represent a fifth of the population depending on their income. The graph reveals different aspects of wealth distribution in developing countries:
- The difference in income in rural areas is minor, whereas poor people in cities have remarkably less income than the highest quintile.
- Firewood is an energy resource for the poor.
- Citizens with high income prefer gas and electricity as energy resources.
- Energy efficiencies is higher in cities.
The high share of firewood in the energy consumption of developing countries derives from the fact that 75% of people in rural areas use it for cooking, compared to 35% in urban areas. Improved cooking stoves are only used by a fourth of the households using firewood as cooking resource.
Energy System Transformations – Opportunities, Trade‐offs and Risks
Conclusions
- Development and carbon emissions highly correlated
- At current (relative) prices of fossil fuels it is not realistic to expect a decarbonization of development patters in the short term (without policy intervention)
- Low carbon technologies, particularly renewable energy not cost competitive in the short run
- Even on smallest scale, high income threshold
- Strategies to decarbonize energy systems on large scale are necessary and feasible, but might collide with other development goals
- Short term strategy: Improve institutional quality and provide minimum access to basic infrastructures to help the poor
Further Information
- Doll, Christopher N.H. and Pachauri, S. (2010): Estimating rural populations without access to electricity in developing countries through night‐time light satellite imagery. Energy Policy, 38(10), pp. 5661‐5670.
- Edenhofer et al. (2011): Renewable Energy in the Context of Sustainable Development. In IPCC Special Report on Renewable Energy Sources and Climate Change Mitigation.
- GEA (2012): Global Energy Assessment – Toward a Sustainable Future, Cambridge University Press, Cambridge UK and New York, NY, USA and the International Institute for Applied Systems Analysis, Laxenburg, Austria.
- Grübler, A., 2004. Transitions in energy use. In: Cleveland, C.G. (Ed.), Encyclopedia of Energy, Vol. 6. Elsevier.
- IEA (International Energy Agency) 2010, World Energy Outlook 2010, OECD/IEA, Paris.
- Jakob, M., M. Haller, R. Marschinski (2012): Will History Repeat Itself? Economic Convergence and Convergence in Energy Use Patterns. Energy Economics 34, p. 95‐104.
- Jakob, M., R. Marschinski, M. Hübler (2013): Between a Rock and a Hard Place: A Trade‐Theory Analysis of Leakage under Production‐ and Consumption‐Based Policies. Environmental and Resource Economics, forthcoming.
- Jakob and Steckel (2013): How climate change mitigation could harm development in poor countries. WIREs Climate Change, forthcoming.
- Knopf, Brigitte; Yen‐Heng Henry Chen, Enrica De Cian, Hannah Förster, Amit Kanudia, Ioanna Karkatsouli, Ilkka Keppo , Tiina Koljonen, Katja Schumacher, Detlef P. van Vuuren: Beyond 2020 ‐ Strategies and costs for transforming the European energy system. Overview paper of the EMF28 model comparison of the EU Energy Roadmap, Climate Change Economics.
- Luderer G, Krey V, Calvin K, Merrick J, Mima S, Pietzcker RC, Vliet J van, Wada K (2013): The role of renewable energy in climate stabilization: results from the EMF27 scenarios. Clim Change, in press.
- Schäfer, A. (2005): Structural change in energy use, Energy Policy, 33(4), pp. 429‐437.
- Steckel, J., M. Jakob, R. Marschinski and G. Luderer (2011): From carbonization to decarbonization? Past trands and future scenarios for China’s CO2 emissions. Energy policy, 39 (6), pp. 3443‐3455.
- Steckel, J, RJ Brecha, M. Jakob, J. Strefler, G. Luderer (2013): Development without energy? Assessing future scenarios of energy consumption in developing countries. Ecological Economics, 90, pp. 53‐67.
- David I. Stern. (2011): The role of energy in economic growth in “Ecological Economics Reviews.” Robert Costanza, Karin Limburg & Ida Kubiszewski, Eds. Ann. N.Y. Acad. Sci. 1219: 26–51.
References

