Indonesian Micro-hydro Power Sites: Survey on Key Performance Indicators (2012)
Overview
In September 2012, Energising Development (EnDev) Indonesia launched a Key Performance Indicator (KPI) survey amongst 47 sites in Sulawesi and Sumatera. KPIs are a set of information that provides an indication of a MHP’s performance and subsequent sustainability. The MHP sites surveyed have received substantial technical support through the MHP Technical Support Unit (TSU) from 2010 to 2012, which availed technical and training support to rural communities through-out the entire process of the MHPs’ establishment. MHP-TSU, a component of EnDev Indonesia, was specifically designed to ensure the quality and ultimate sustainability of community-operated MHP facilities. Funding for the MHP’s was obtained via the Government of Indonesia’s GreenPNPM programme.
The KPI study coincides with a recently published study entitled Micro Hydro Power (MHP) Return of Investment and Cost Effectiveness Analysis (Final Report, 17 September 2012) by The World Bank Group (WBG). This report was also reviewed and compared with the KPI results, and an overview comparison included as Appendix C. In general, both studies arrive at very similar conclusions.
Key Performance Indicator (KPI) Survey
Capacity
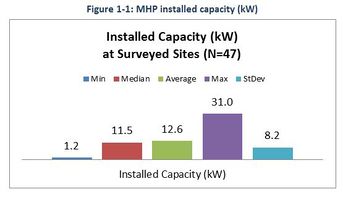
Under the KPI survey, the average installed measured capacity for the MHP plants was 12.6kW.
At this “low” installed capacity, the economic performance in terms of capital cost per installed kW is poor, but improves dramatically with higher capacity MHPs.
Capital Costs
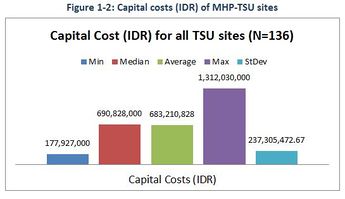
MHP-TSU has supported the establishment of 136 MHP sites in Sulawesi and Sumatera. The capital investment, as provided by GreenPNPM, is substantial. Due to the high degree of site-specific customisation, the costs of an MHP scheme can only be reliably assessed, once a site inspection was conducted and a detailed engineering drawing and bill of quantities drawn up. This implies that initial consulting-type services are required and the cost and time requirements thereof should be considered in MHP projects.
Connected Households
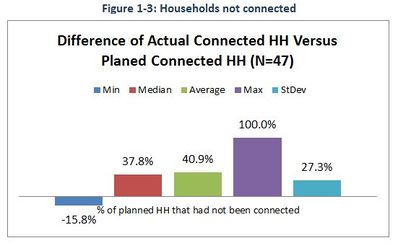
During the initial site verification, which then led to detailed planning, engineering drawings and bills of quantities, many more households were identified than were ultimately connected. In average, only about 60% of the planned households in a village were actually connected by the time of the KPI survey. There are several reasons for this including wrong counting during the initial planning phase, inability of households to pay for a connection, expansion of the PLN grid, migration from the village, and insufficient MHP capacity (i.e. actual capacity is less than planned).
Failures
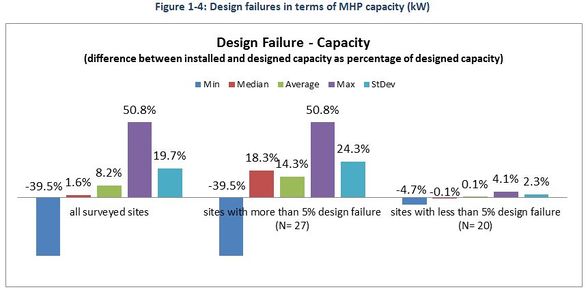
The latter raises issues around the accuracy of the initial site verification and the subsequent planning, but also the compliance of the MHP construction with the engineering plans. Site difficulties often hamper a strict adherence to the engineering drawings, which can result in losses in head and water flow. This impacts the available power output by the MHP. For the 47 MHP-TSU sites surveyed, the average design failure was about 8% between planned and actual capacity (i.e. on average 8% less kW output than planned). The maximum was 50% less capacity, while some sites exceeded the planned capacity by as much as 40%. Given the challenge of correct construction and the fact that civil work was performed by the community (with regular supervision by MHP-TSU field staff) the design failure ratio is most acceptable.
Rural Electrification
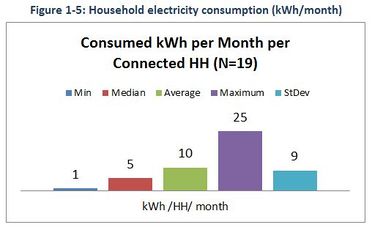
Rural electrification serves a greater purpose of facilitating rural development, in the assumption that access to electricity will improve rural livelihoods. Rural electrification is costly though and off-grid electrification in particular has general limitations regarding the amount of electricity available to each household, rural business and social institution. The graph below reflects the electricity consumed per household per month, based on MHP sites with installed kWh meters (19 metered sites with reliable data).
It is interesting to note that the World Bank Group (WBG) study (see Appendix C) recorded an average 64kWh per month per household (with maximum 152 kWh and minimum 7 kWh). This significant discrepancy can be ascribed to the fact the WBG study considered only the installed capacity (and a spot reading) in its calculations and not actually metered kWh supplied to the households.
Electricity consumption in rural households is generally very low and in most cases the collective consumption and demand is well below the available capacity of the MHP.
Capacity Factor
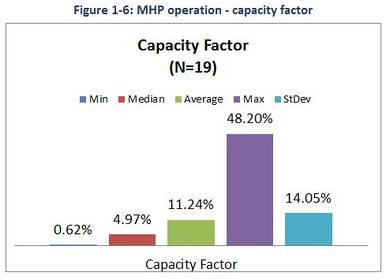
The capacity factor of MHP shows the proportion of effective capacity compared to installed capacity that is expected to be delivered by the MHP to the community. The calculation is by comparing the electricity generation (kWh) from MHP compared to total kWh that is expected to be generated from MHP plant which is working at full capacity continuously (100% availability factor).
From 19 sites, the average MHP capacity factor is only 11.24%, with median of 4.97%. The low median value is caused by the majority of sites that are underutilized while only a few sites had been highly utilized. The poor capacity factor is primarily related to low electricity consumption (further details regarding the influencing factors and scenarios for capacity factor improvement are included in Appendix A).
Despite the currently poor capacity factors for most sites, the KPI survey also recorded an improvement in the capacity factor the longer the MHP operates. This is due to an increased electricity consumption per household over time, productive use of energy applications (i.e. rural businesses using electrical appliances) and greater operational experience by the MHP operator.
Electricity Consumption / Potential
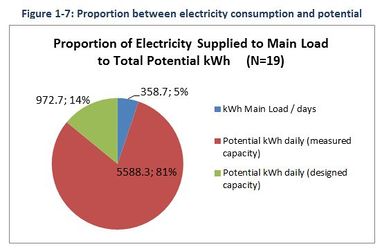
From the data of 19 metered MHP sites, only 5% (358.7 kWh/days) of electricity is used to supply main load. Another 81% (5,588.3 kWh/days) is estimated to be lost through limited operating times (i.e. low availability factor), not fully opened turbine and/or the ballast via the electronic load control (ELC).
Financial Saving for MHP Sustainability
Under the programme GreenPNPM, the community is “owner” of the MHP installation, with a dedicated Village Management Committee (VMC) comprising at least an operator, treasurer and manager, elected and trained to operate and administer the MHP.
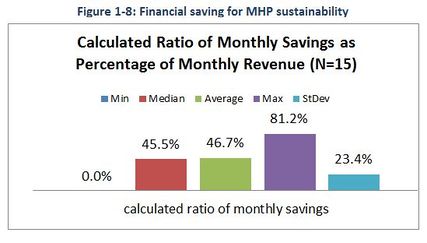
In order to ensure the MHP’s sustainability, revenue is collected from connected households, which is used to pay the VMC members and save funds for maintenance and future replacement. VMC training is conducted under MHP-TSU and the proportion between savings and operational overheads is an indication of how well a VMC accommodates future expenditures.
Of the 47 sites surveyed, only 15 sites maintain sufficiently concise financial records to determine whether the community will have sufficient resources, by saving an average of 45% of total revenue for future expenses.
The KPI survey collected a wealth of information, with the most pertinent information presented in this report. Since the capacity factor, and its subsequent effect on economic feasibility of MHP-based rural electrification, has emerged as one of the most critical shortcomings of the surveyed sites, Appendix A analyses the capacity factor in more detail and assess its sensitivities and root causes. Appendix B of this report summarises all formulae used for during data analysis, as well as the data type and source. Appendix C provides a comparative overview between the data collected and information presented by this KPI survey and the Micro Hydro Power (MHP) Return of Investment and Cost Effectiveness Analysis (Final Report, 17 September 2012) by The World Bank Group (WBG). Considering that most MHP have surplus capacity, Appendix D takes a closer look at electricity utilisation and the potential for a) additionally connected households, b) increased household consumption and b) expanding the productive use of electricity (PUE).
Further Information
- Indonesia Energy Situation
- Hydro Portal on energypedia
- Micro Hydro Power (MHP) Indonesia Cost Effectiveness Analysis Report (World Bank Group, September 2012)
- Baseline Report on Micro Hydro Power (MHP) Sites Selected for EnDev 2 in Indonesia (May 2011)
- Report on MHP sites supported by EnDev I in Indonesia
- Micro Hydro Power (MHP) Troubleshooting Poster for Operators in Indonesia
- Productive Use of Energy through micro-hydro power in rural Indonesia (Youtube)
References

